

ACME Credit Card Fraud Investigator Dashboard
Project overview :
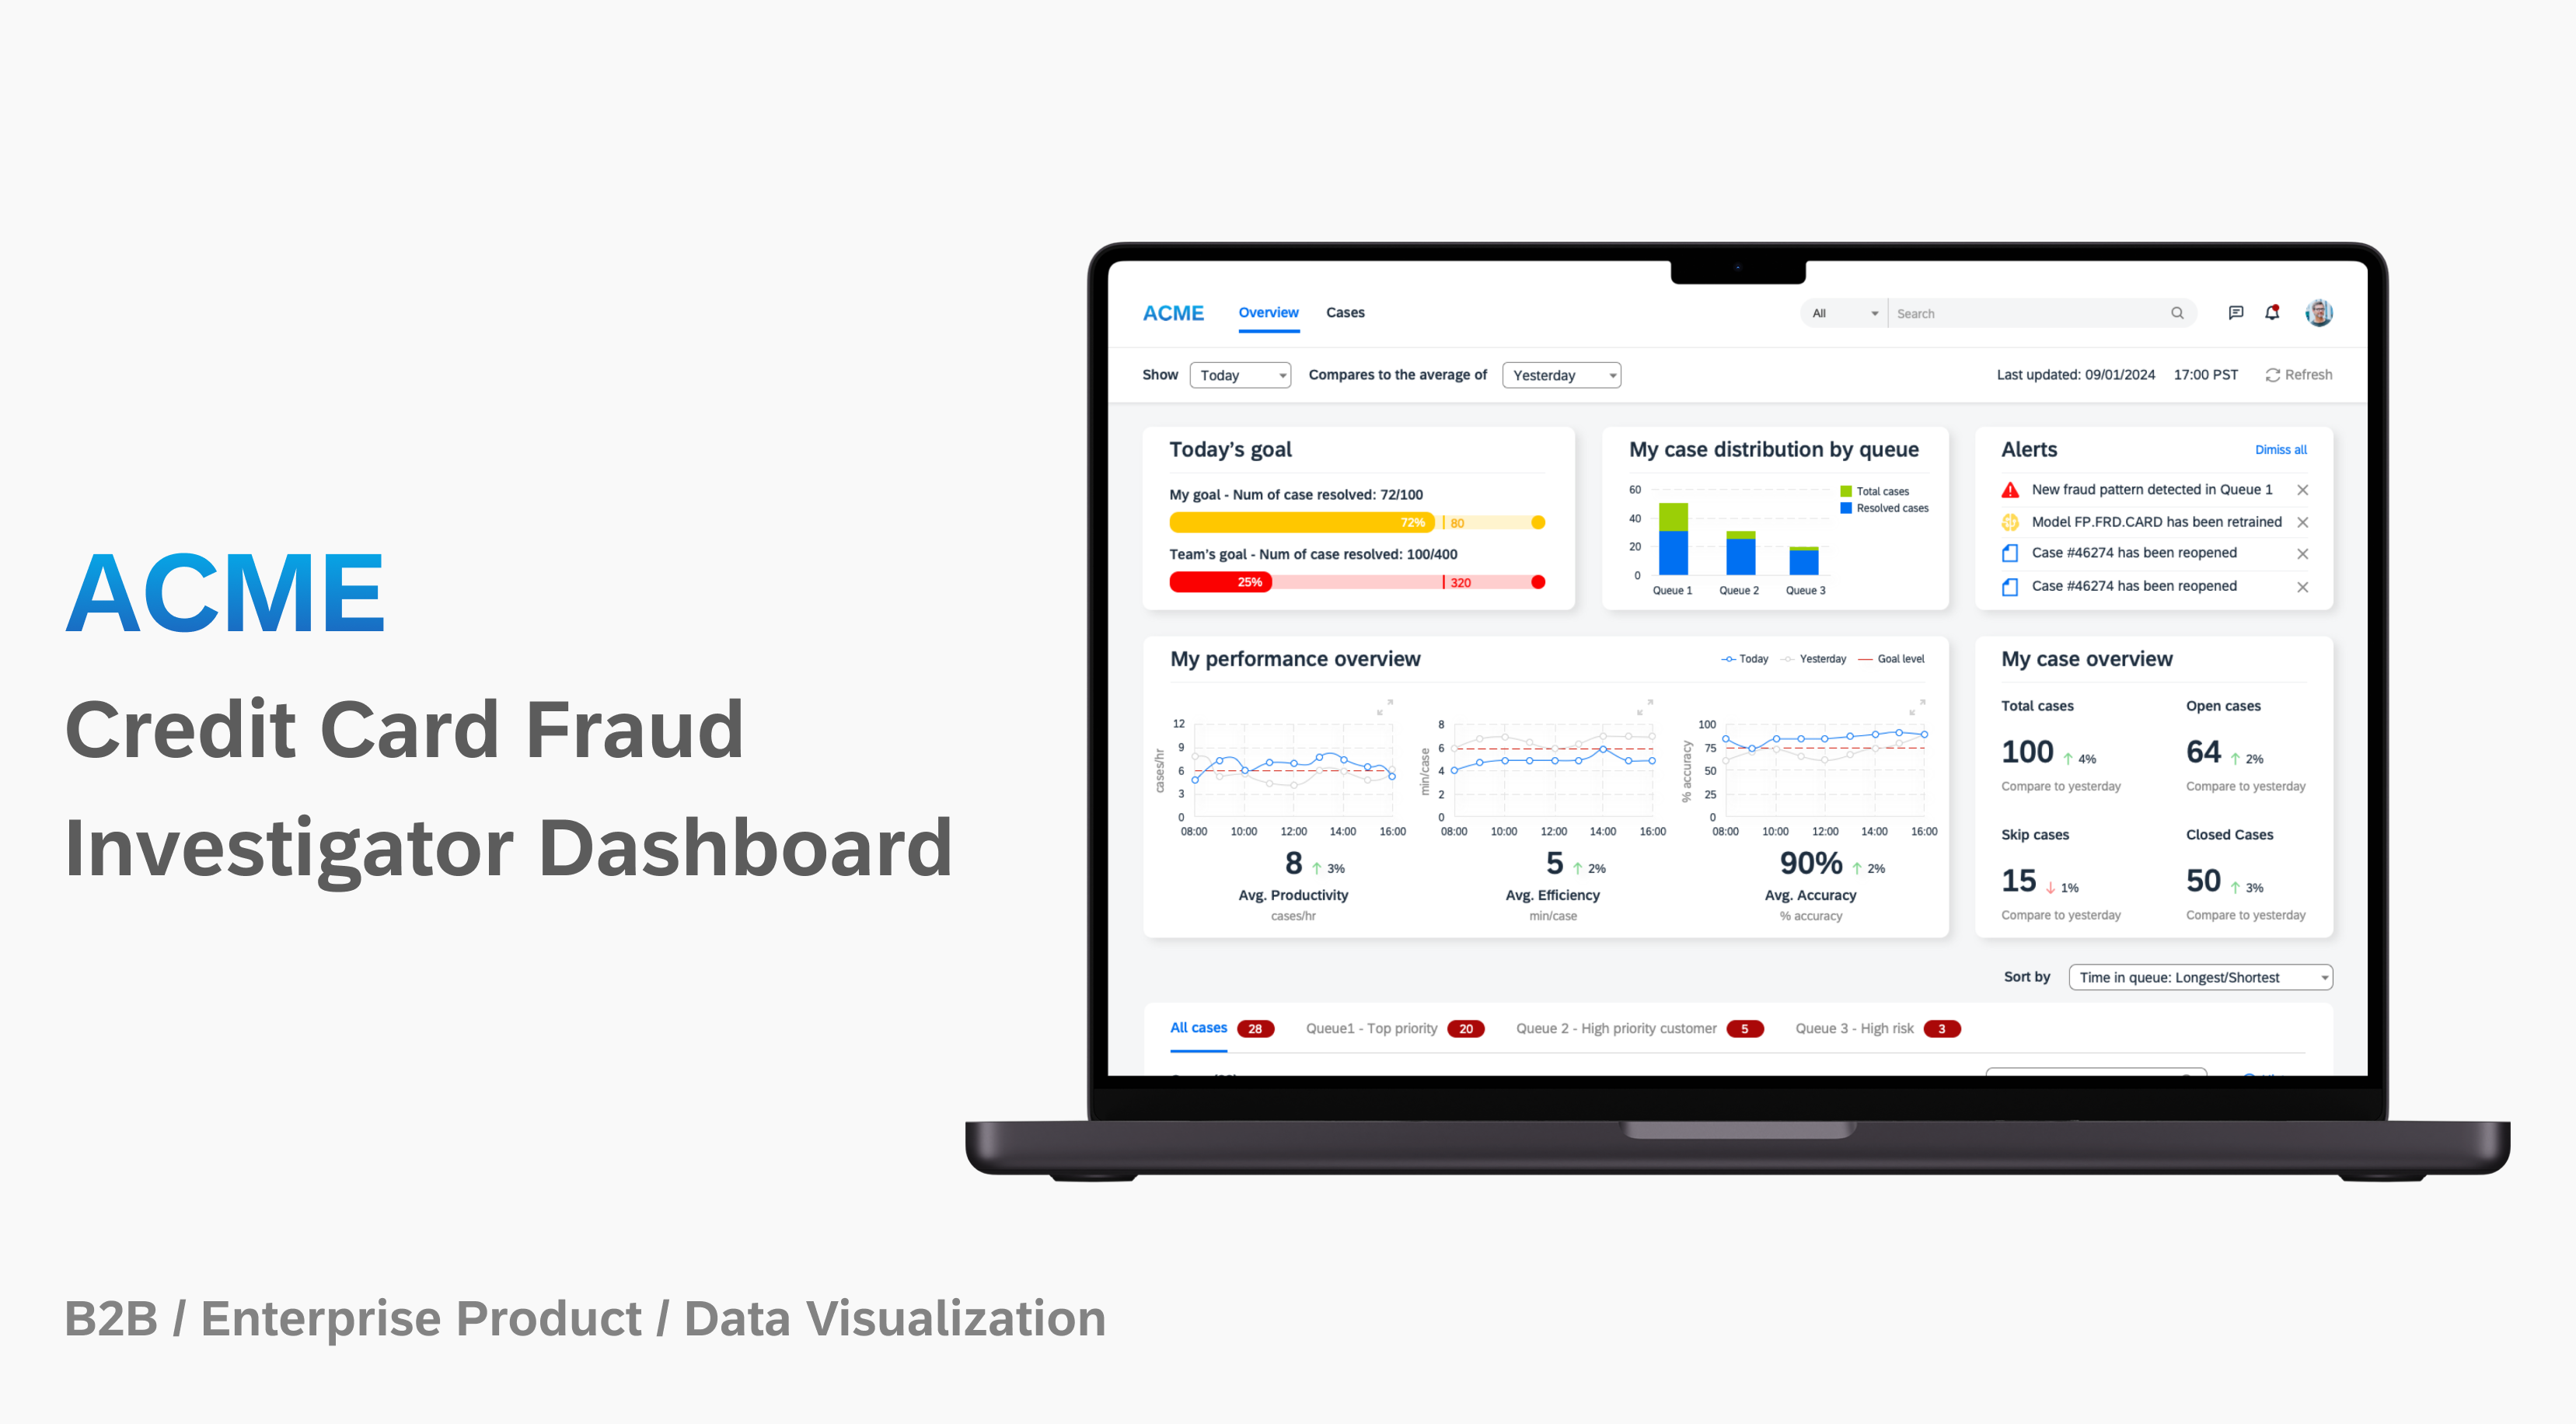
ACME Credit Card Fraud Investigator Dashboard is a streamlined SaaS platform for fraud investigators to efficiently monitor credit card cases and access data, supporting accurate decisions and improved fraud detection.
Problem
The client needs a new SaaS platform to replace outdated analytics software, enabling credit card fraud investigators to respond faster and more accurately to suspected credit card fraud.
Solution
Create the platform to enable fraud investigators to
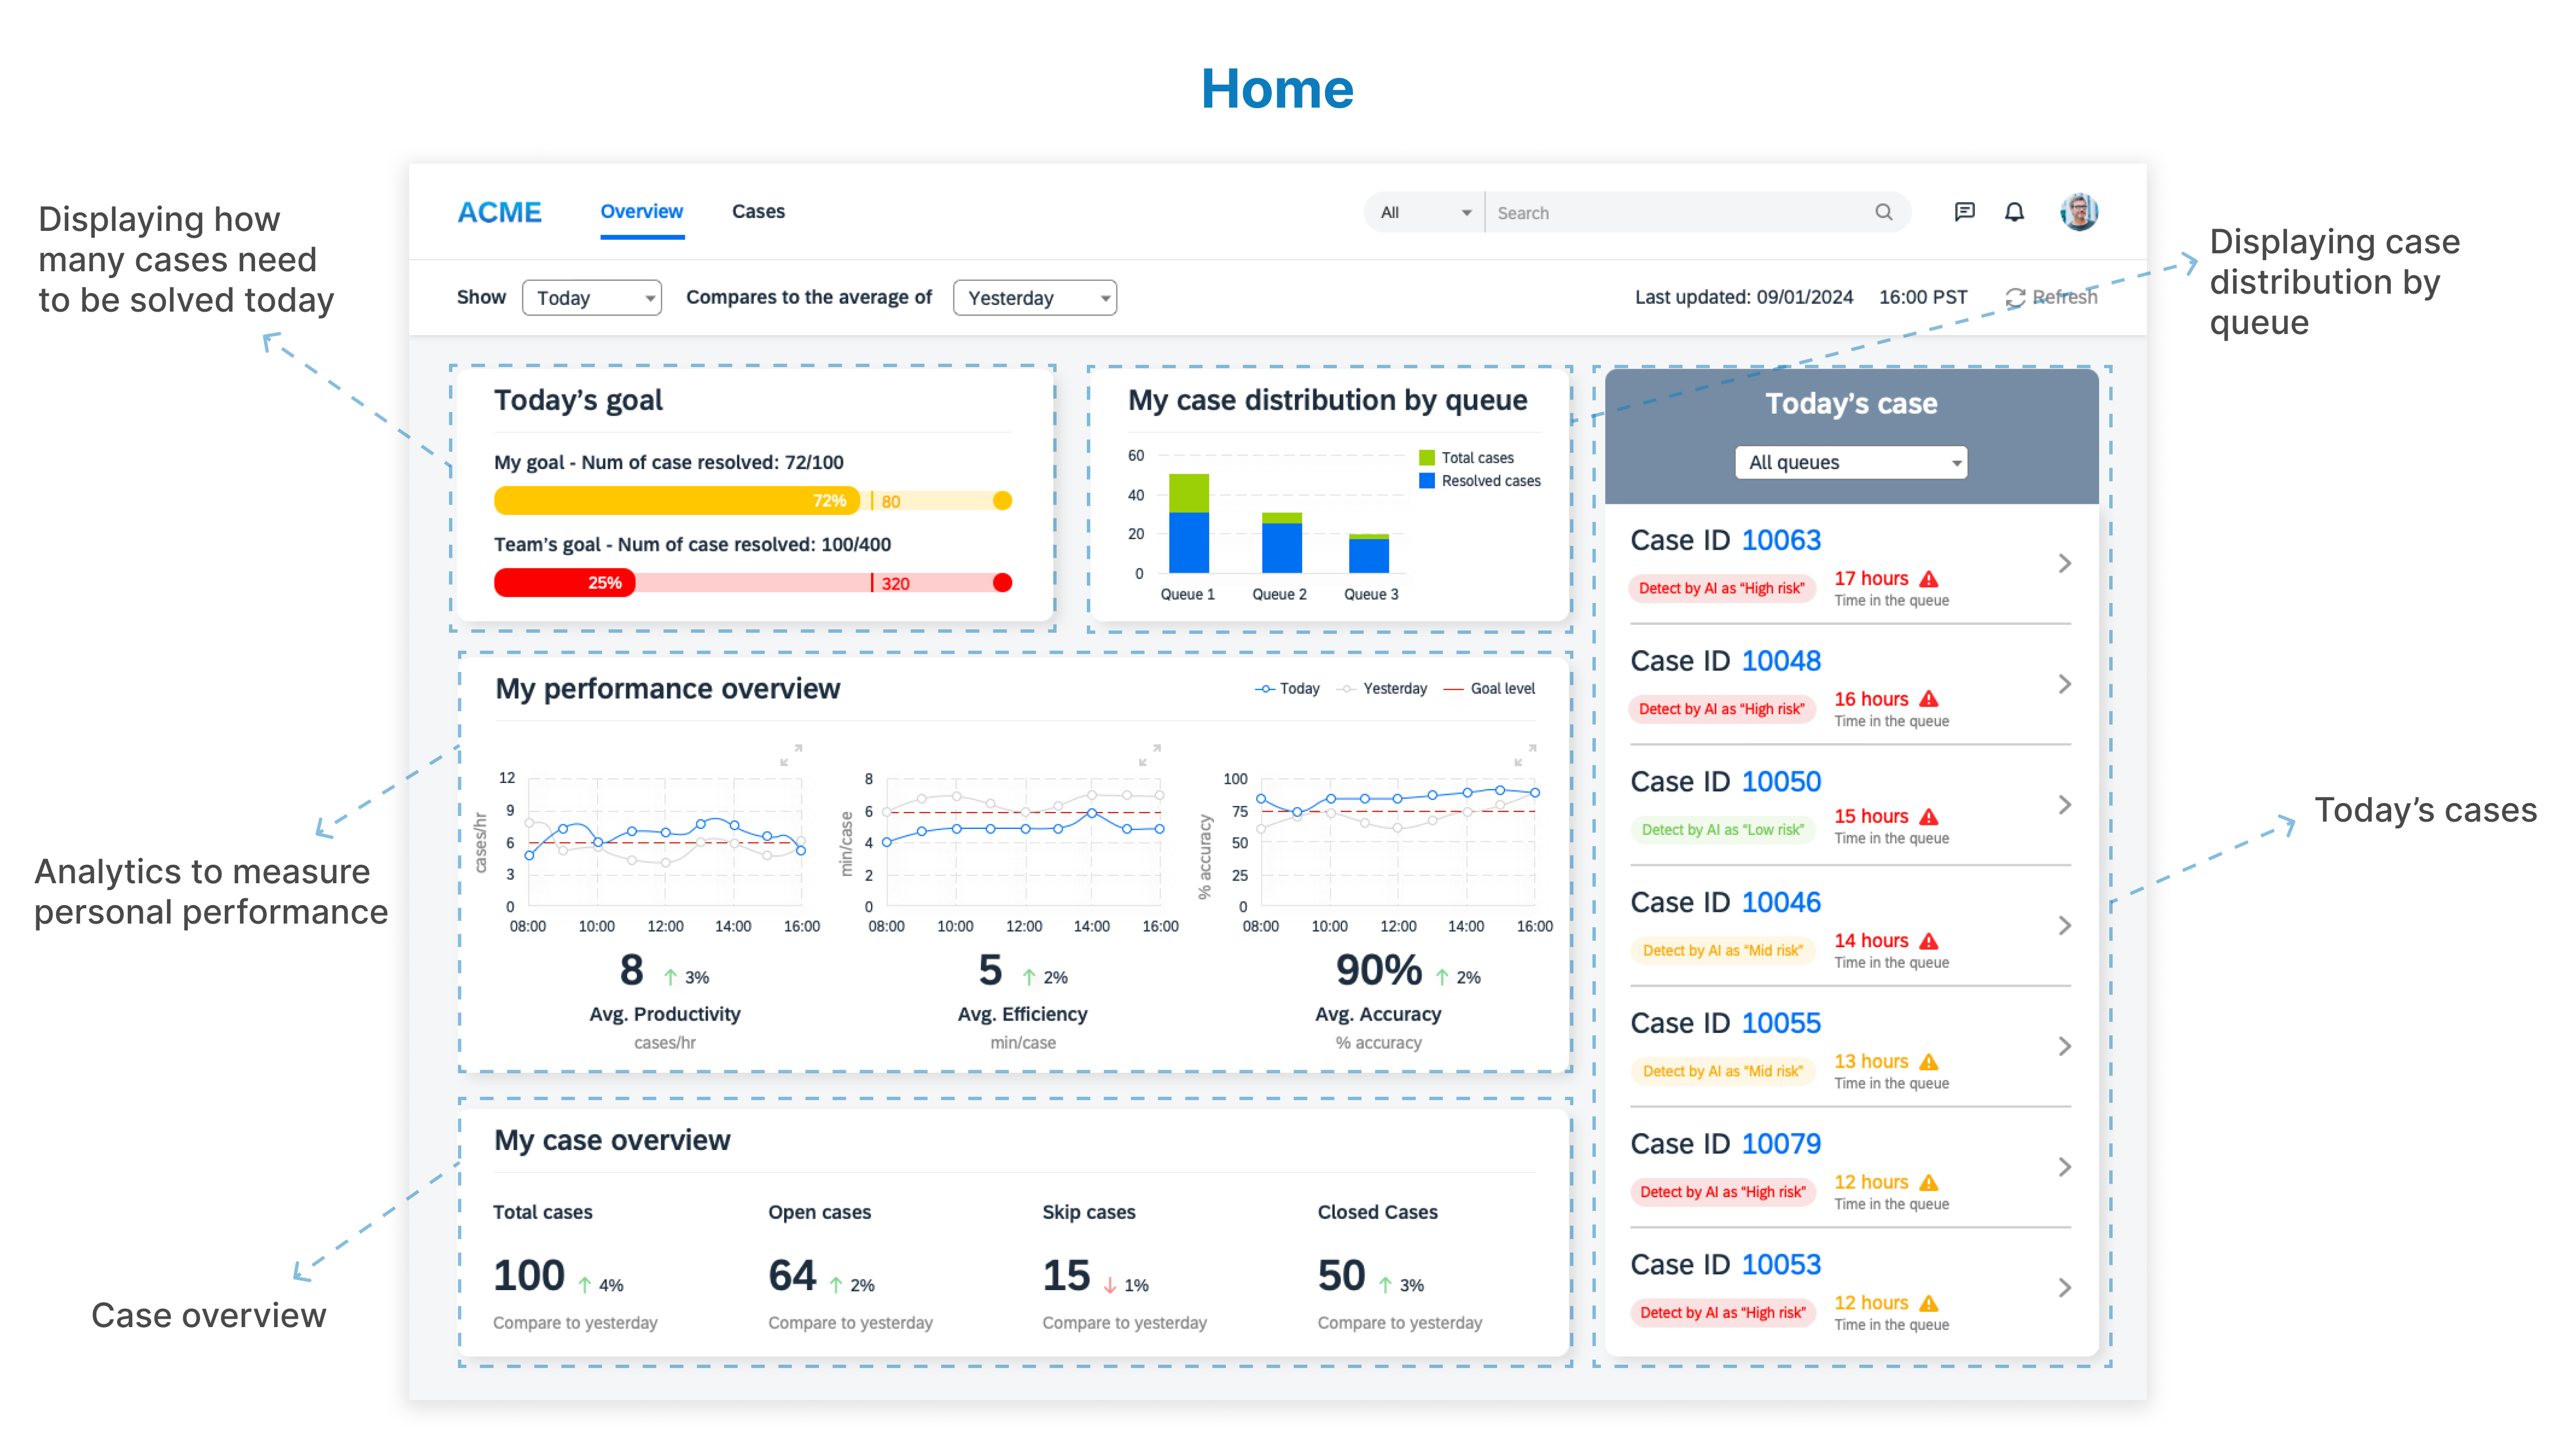
• View clear, at-a-glance data for accurate decisions
• Access detailed timelines and case histories for full context
• Track the number of cases they need to solve each day
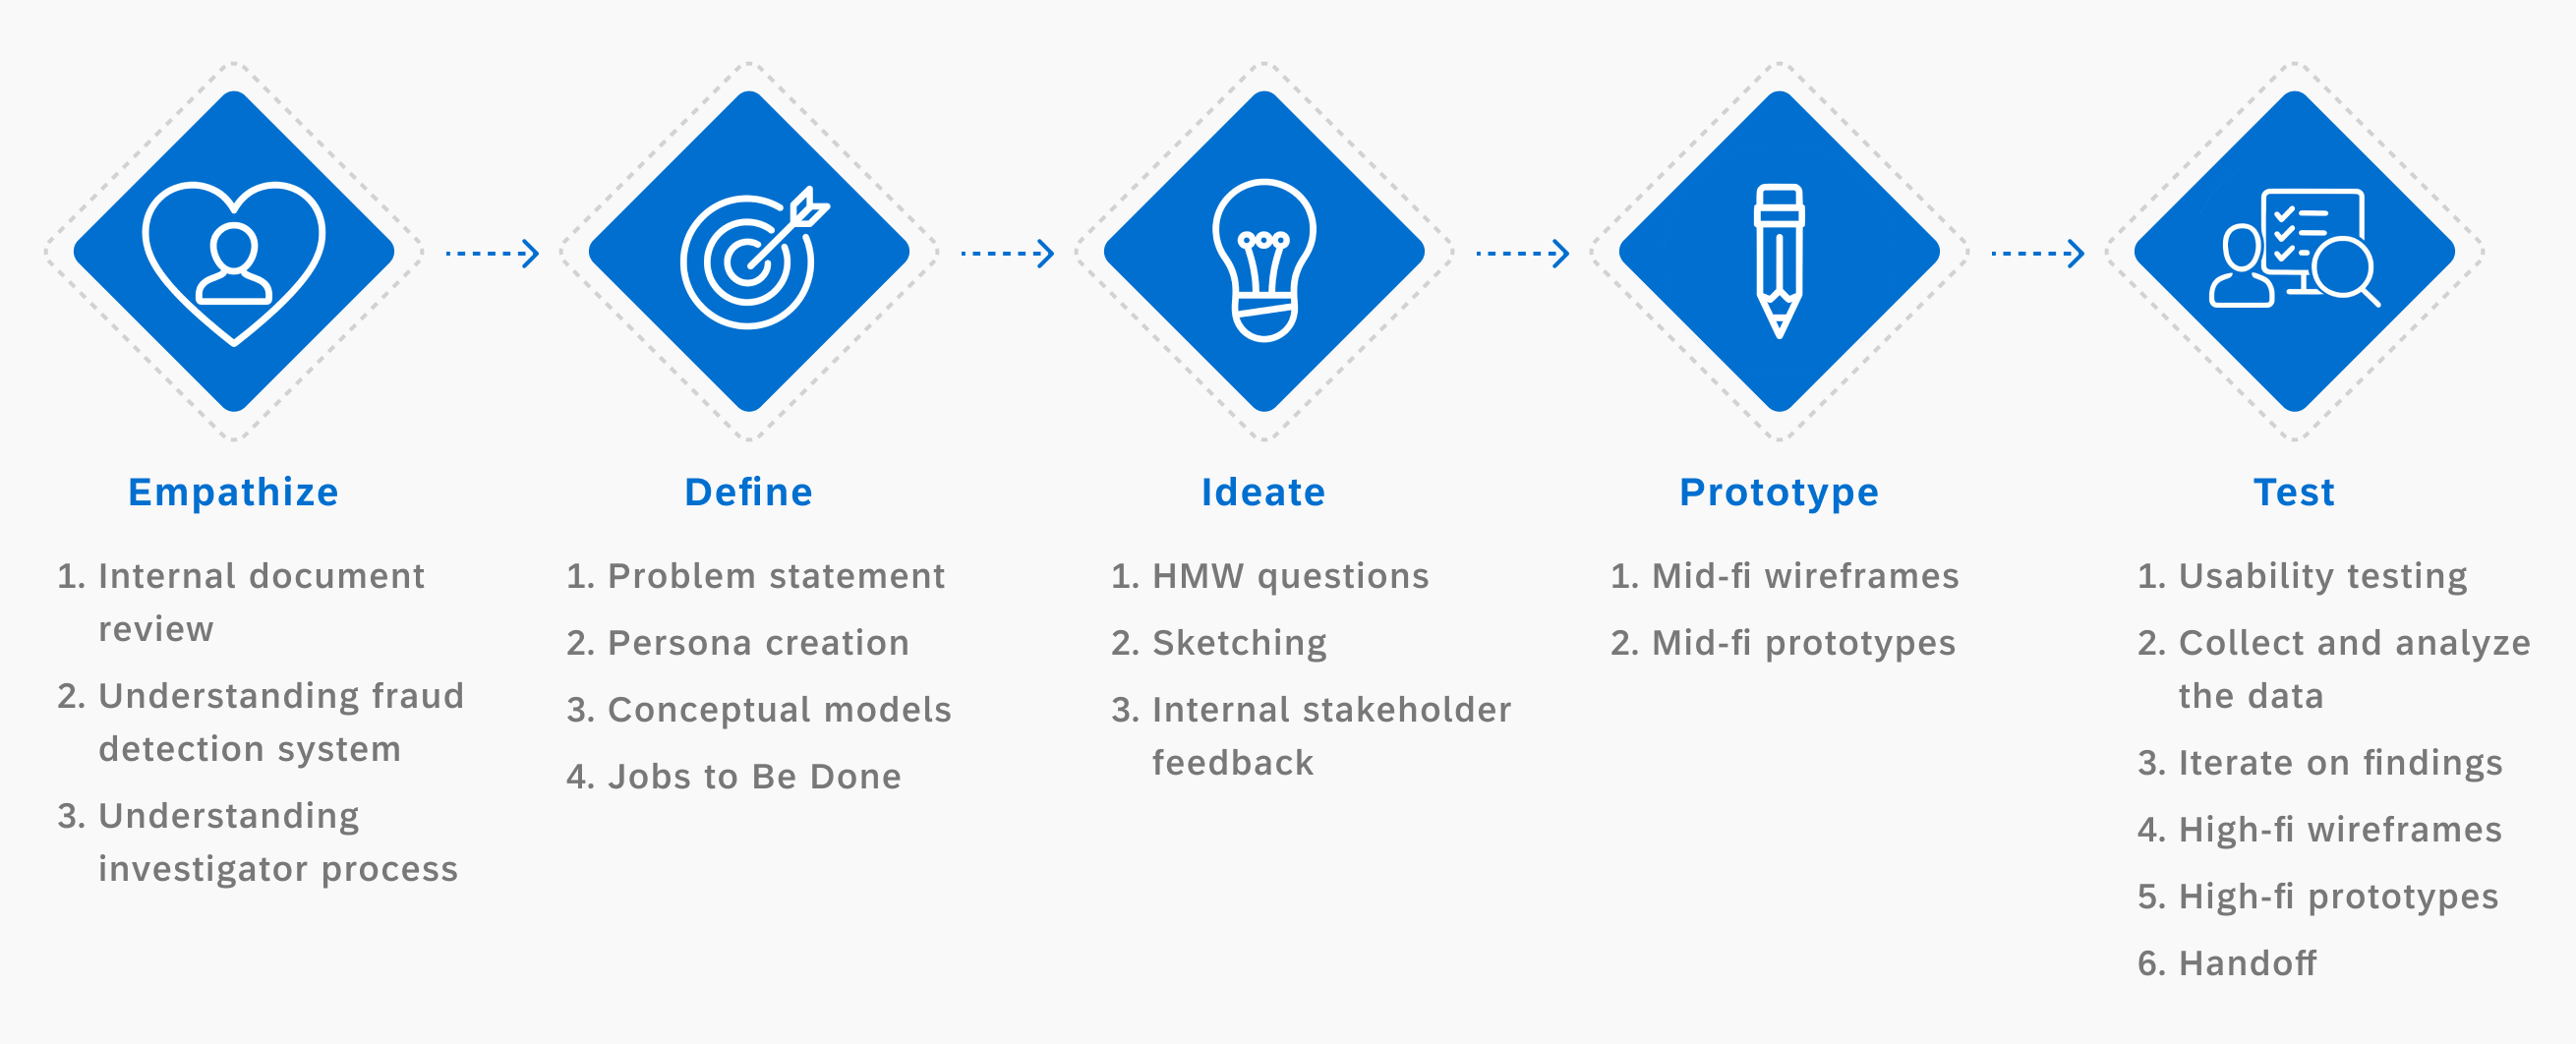
My design process
Entering the world of credit card fraud investigation🧑💻
This is where the journey begins. Before jumping into design, I needed to understand the system, the people, andthe problem.
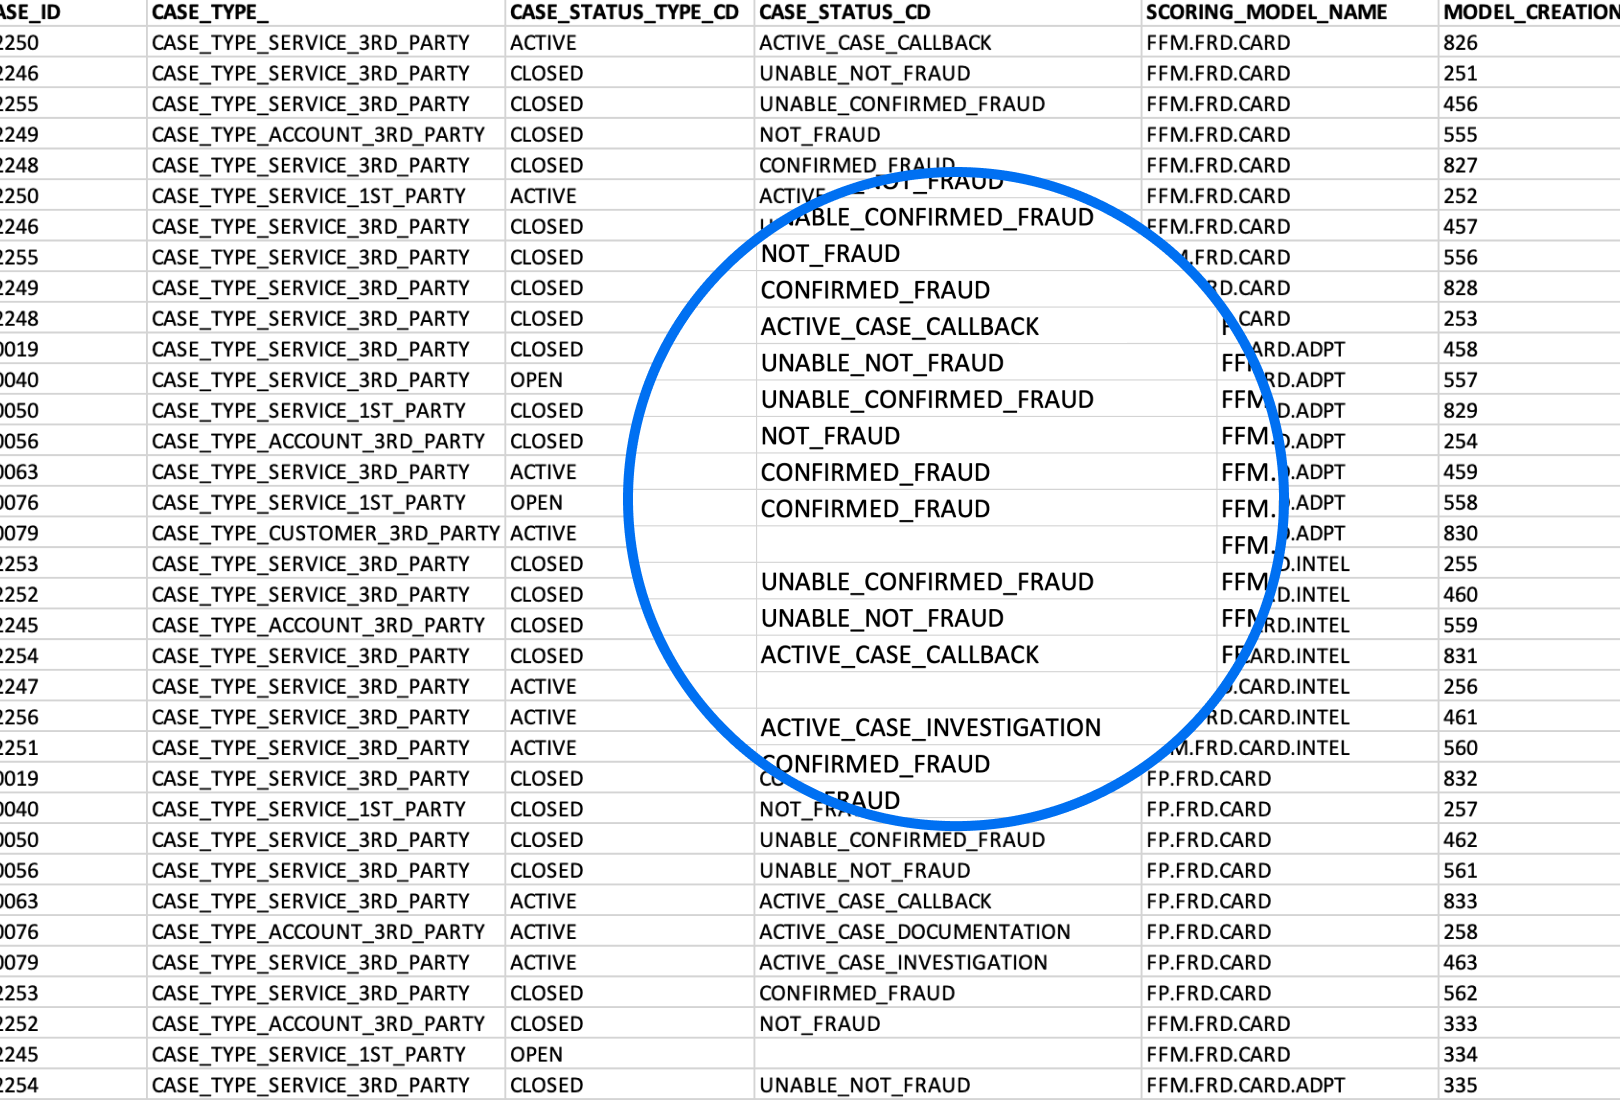
After reading the design brief, requirements, and dataset, I tried to understand how to translate complex data into a product I was not familiar with.
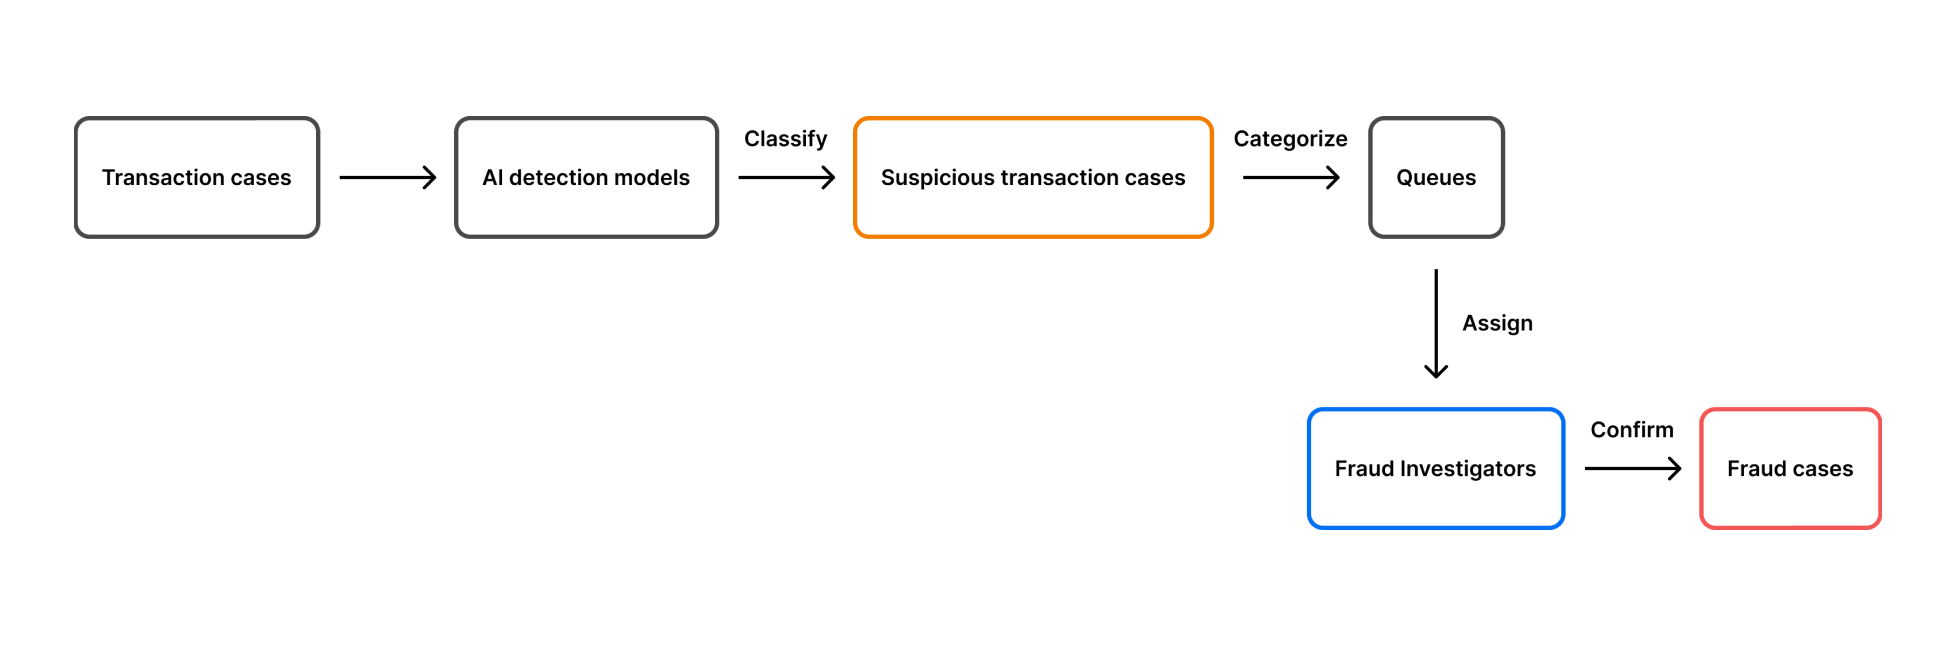
To understand how fraud detection system works 🎯
I delved into the material client provided and asked the PM to come up with a fraud detection flow diagram.
Who am I building this product for? 🤔
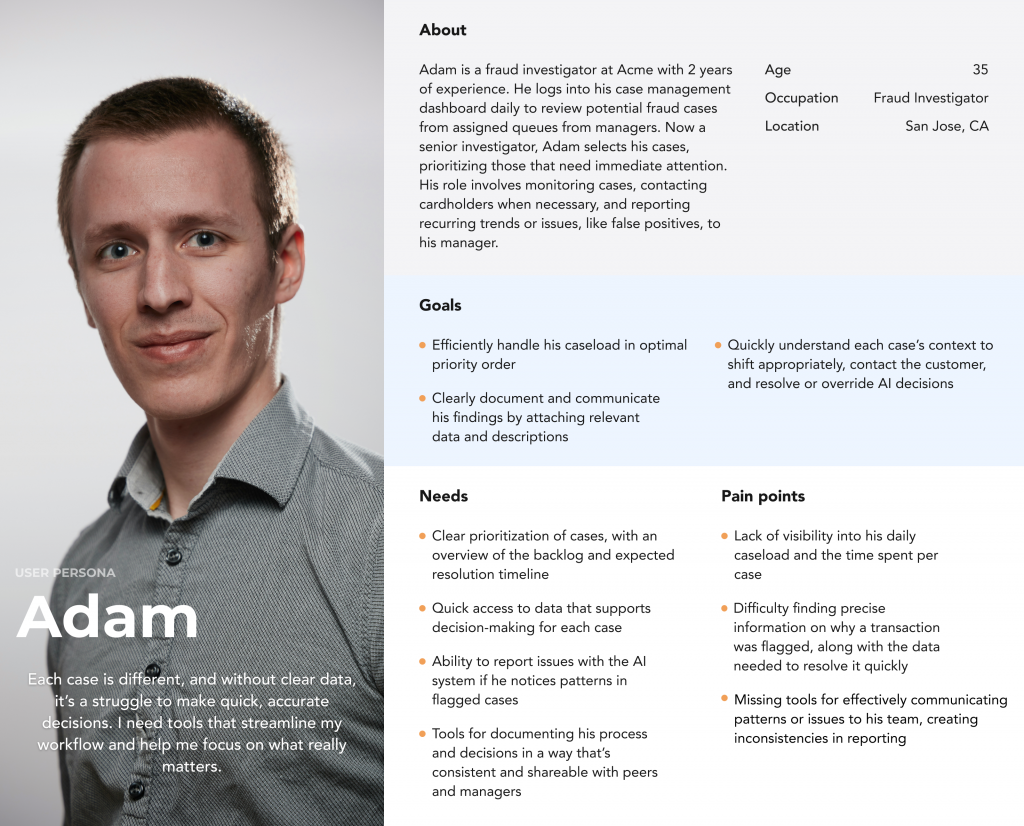
With a foundational understanding of the domain and the investigator’s role, I began asking PM questions to uncover the user’s goals, needs, pain points, and current processes to develop a user persona
How did I tackle Adam’s problems? 🧐
I created conceptual models to identify the data users actually need on the dashboard.
-Conceptual models-
⬇
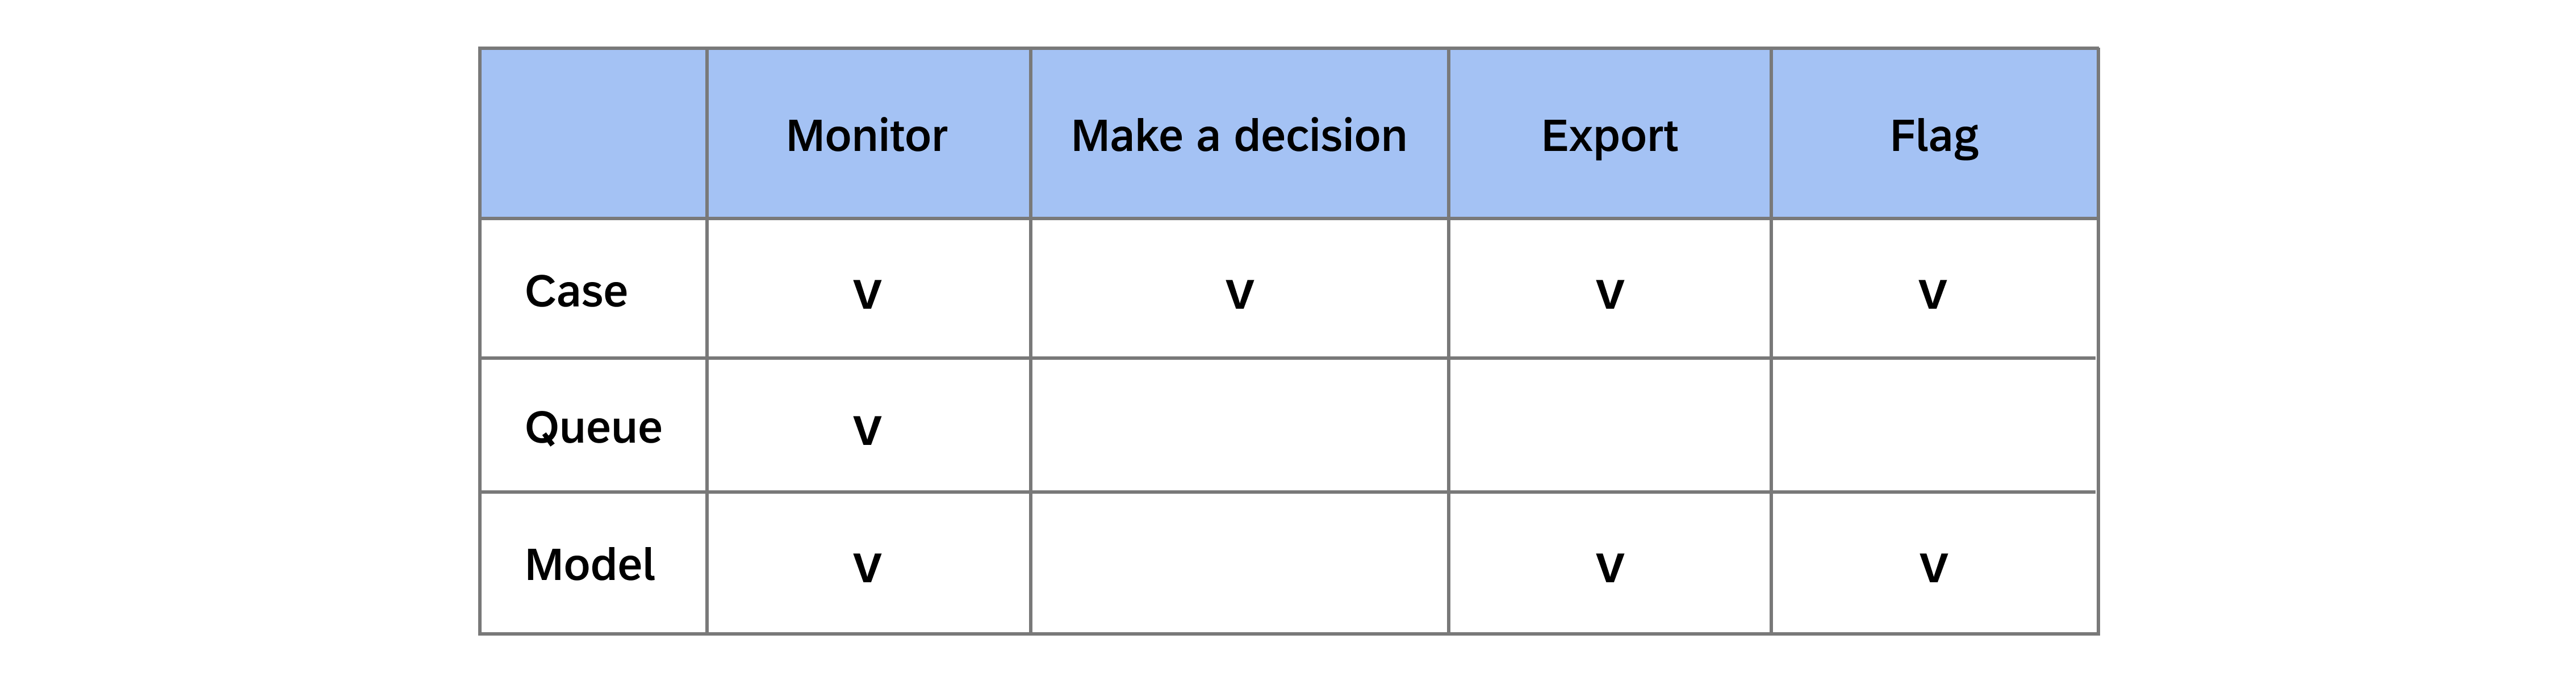
Object action matrix
Before designing the screens, I created an object-action matrix. This matrix outlines the relationship between all the necessary objects and actions in the system. Utilizing this matrix allows for high-level thinking about what elements should be included in the dashboard and how Adam will interact with these elements.
➕
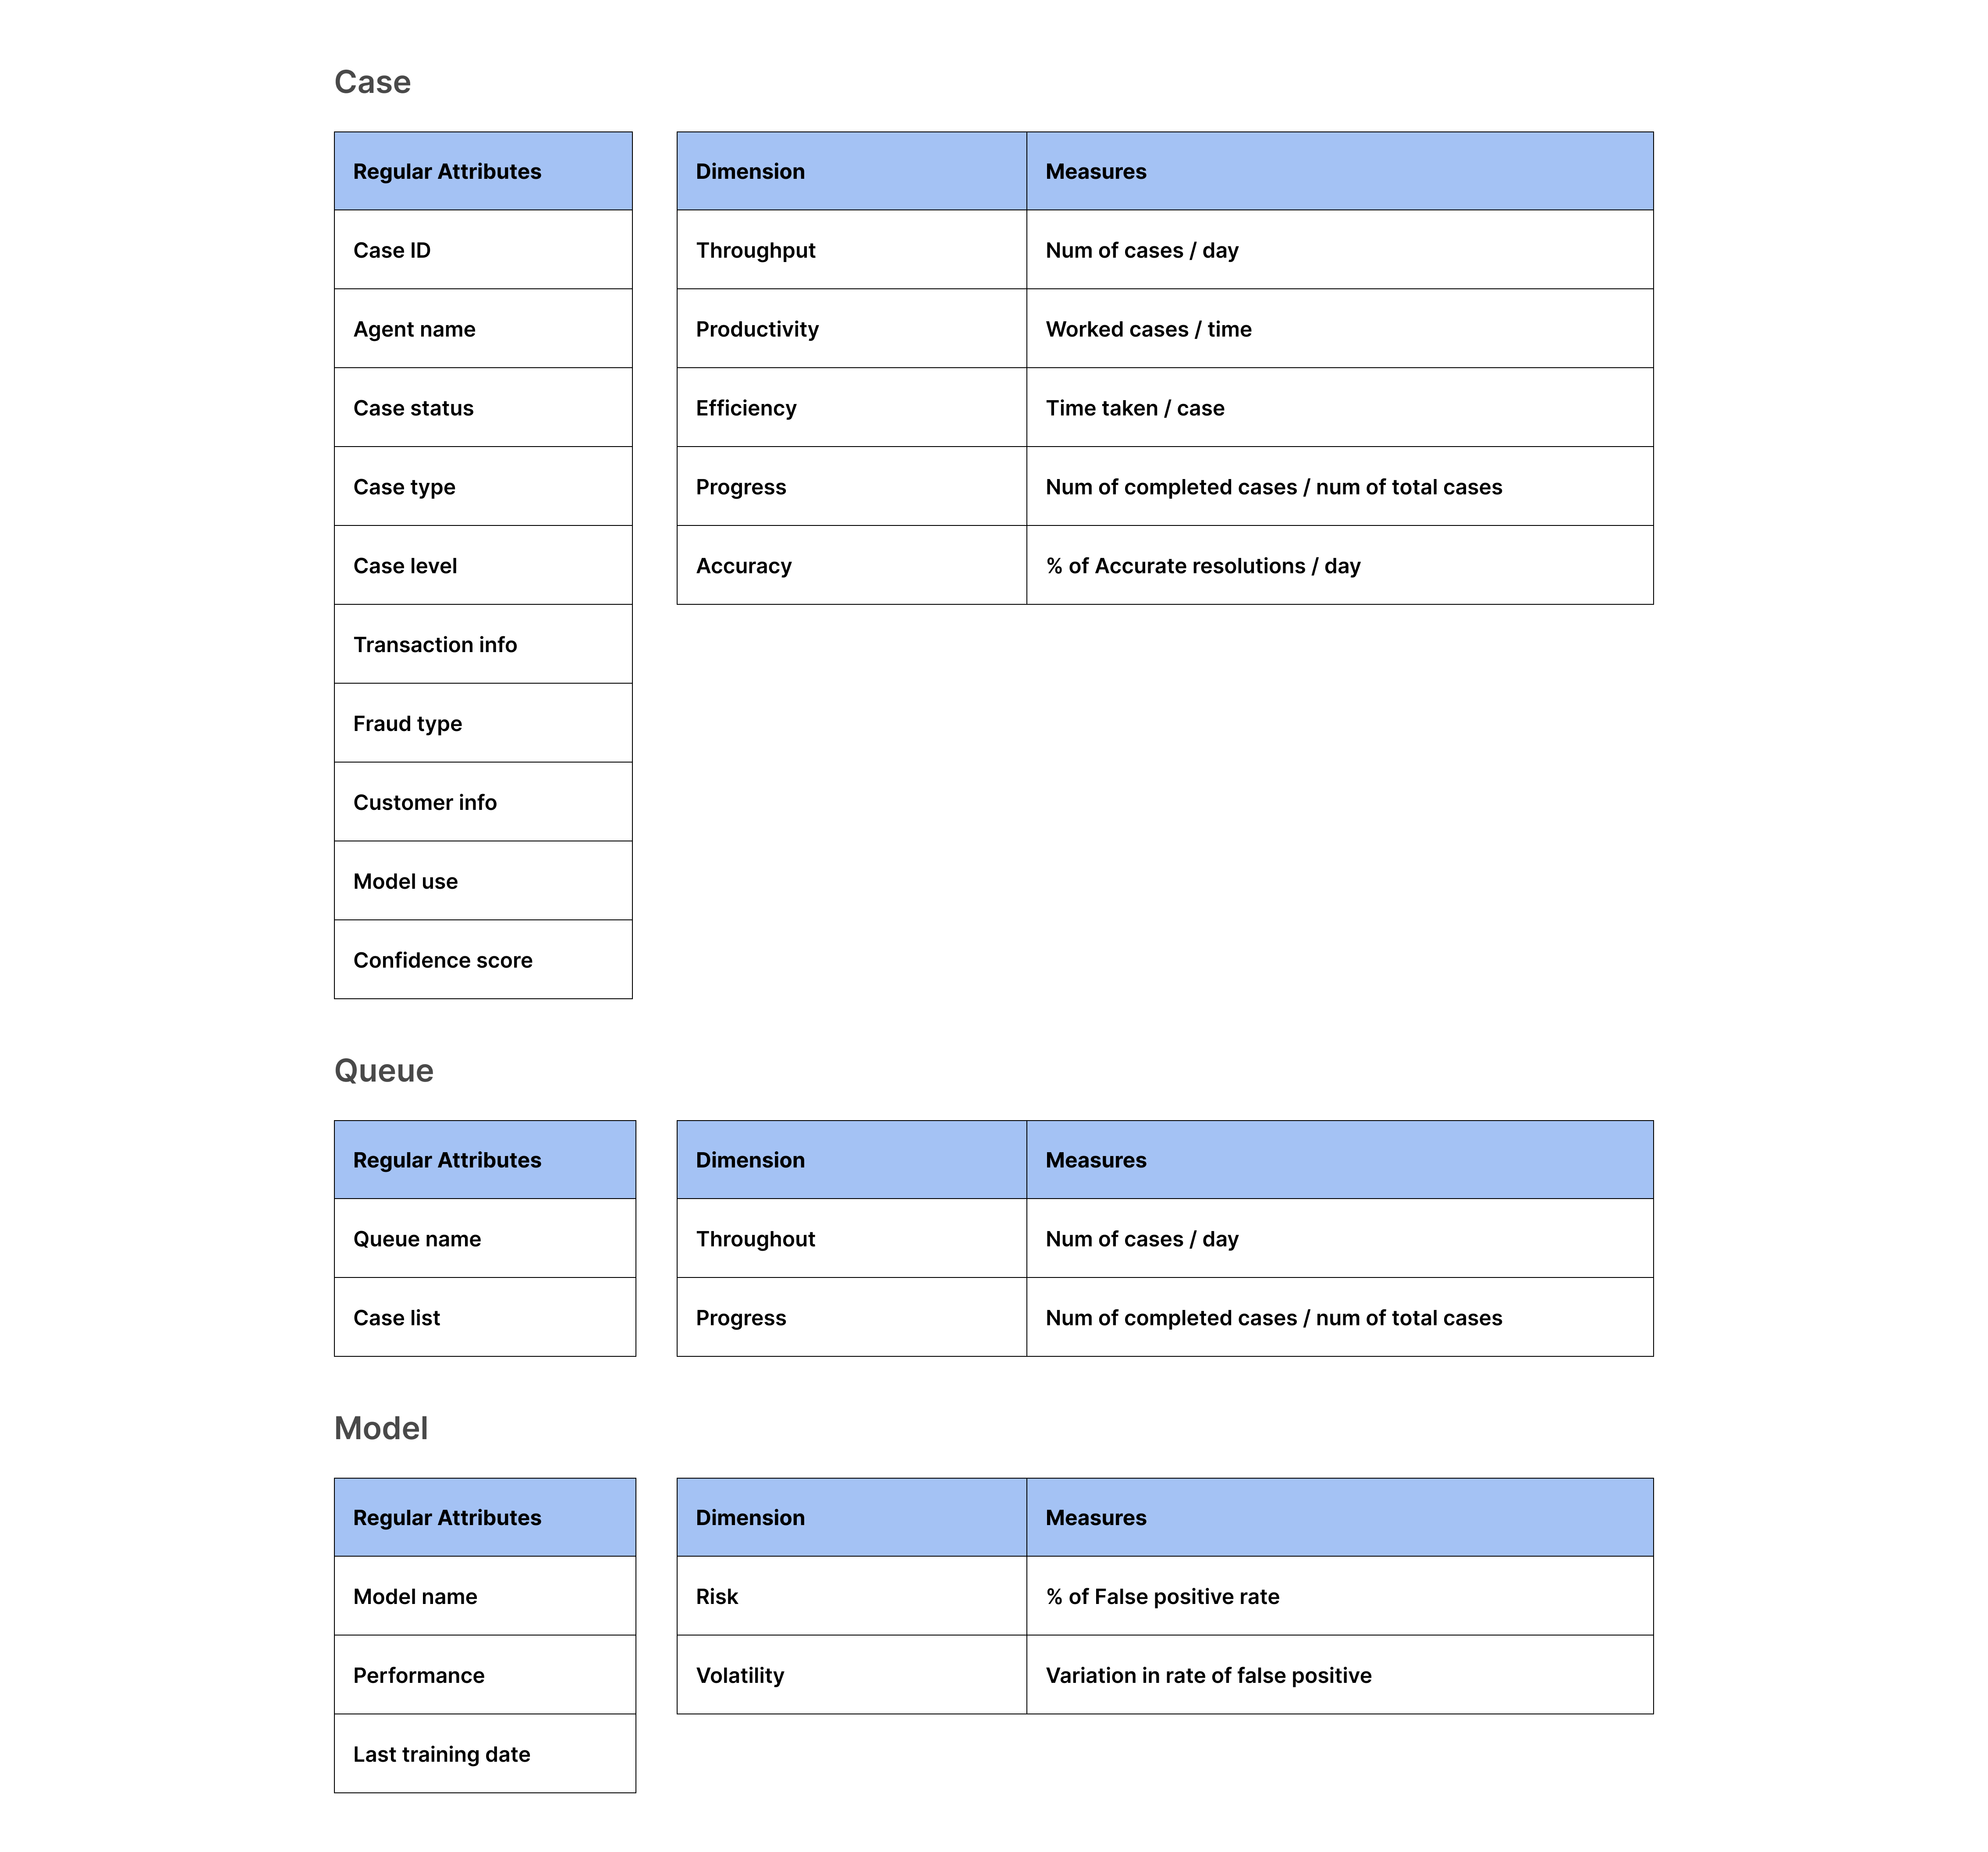
Object attribute matrix
I created an object-attribute matrix. This matrix lists the objects and their related attributes, ensuring consistency with the object-action matrix. It helps me think clearly about the detailed information related to each object and what should be included in the dashboard.
➕
Jobs-to-Be-Done
I also developed a Jobs-to-be-Done framework to understand Adam’s primary responsibilities and identify opportunities to improve his workflow.
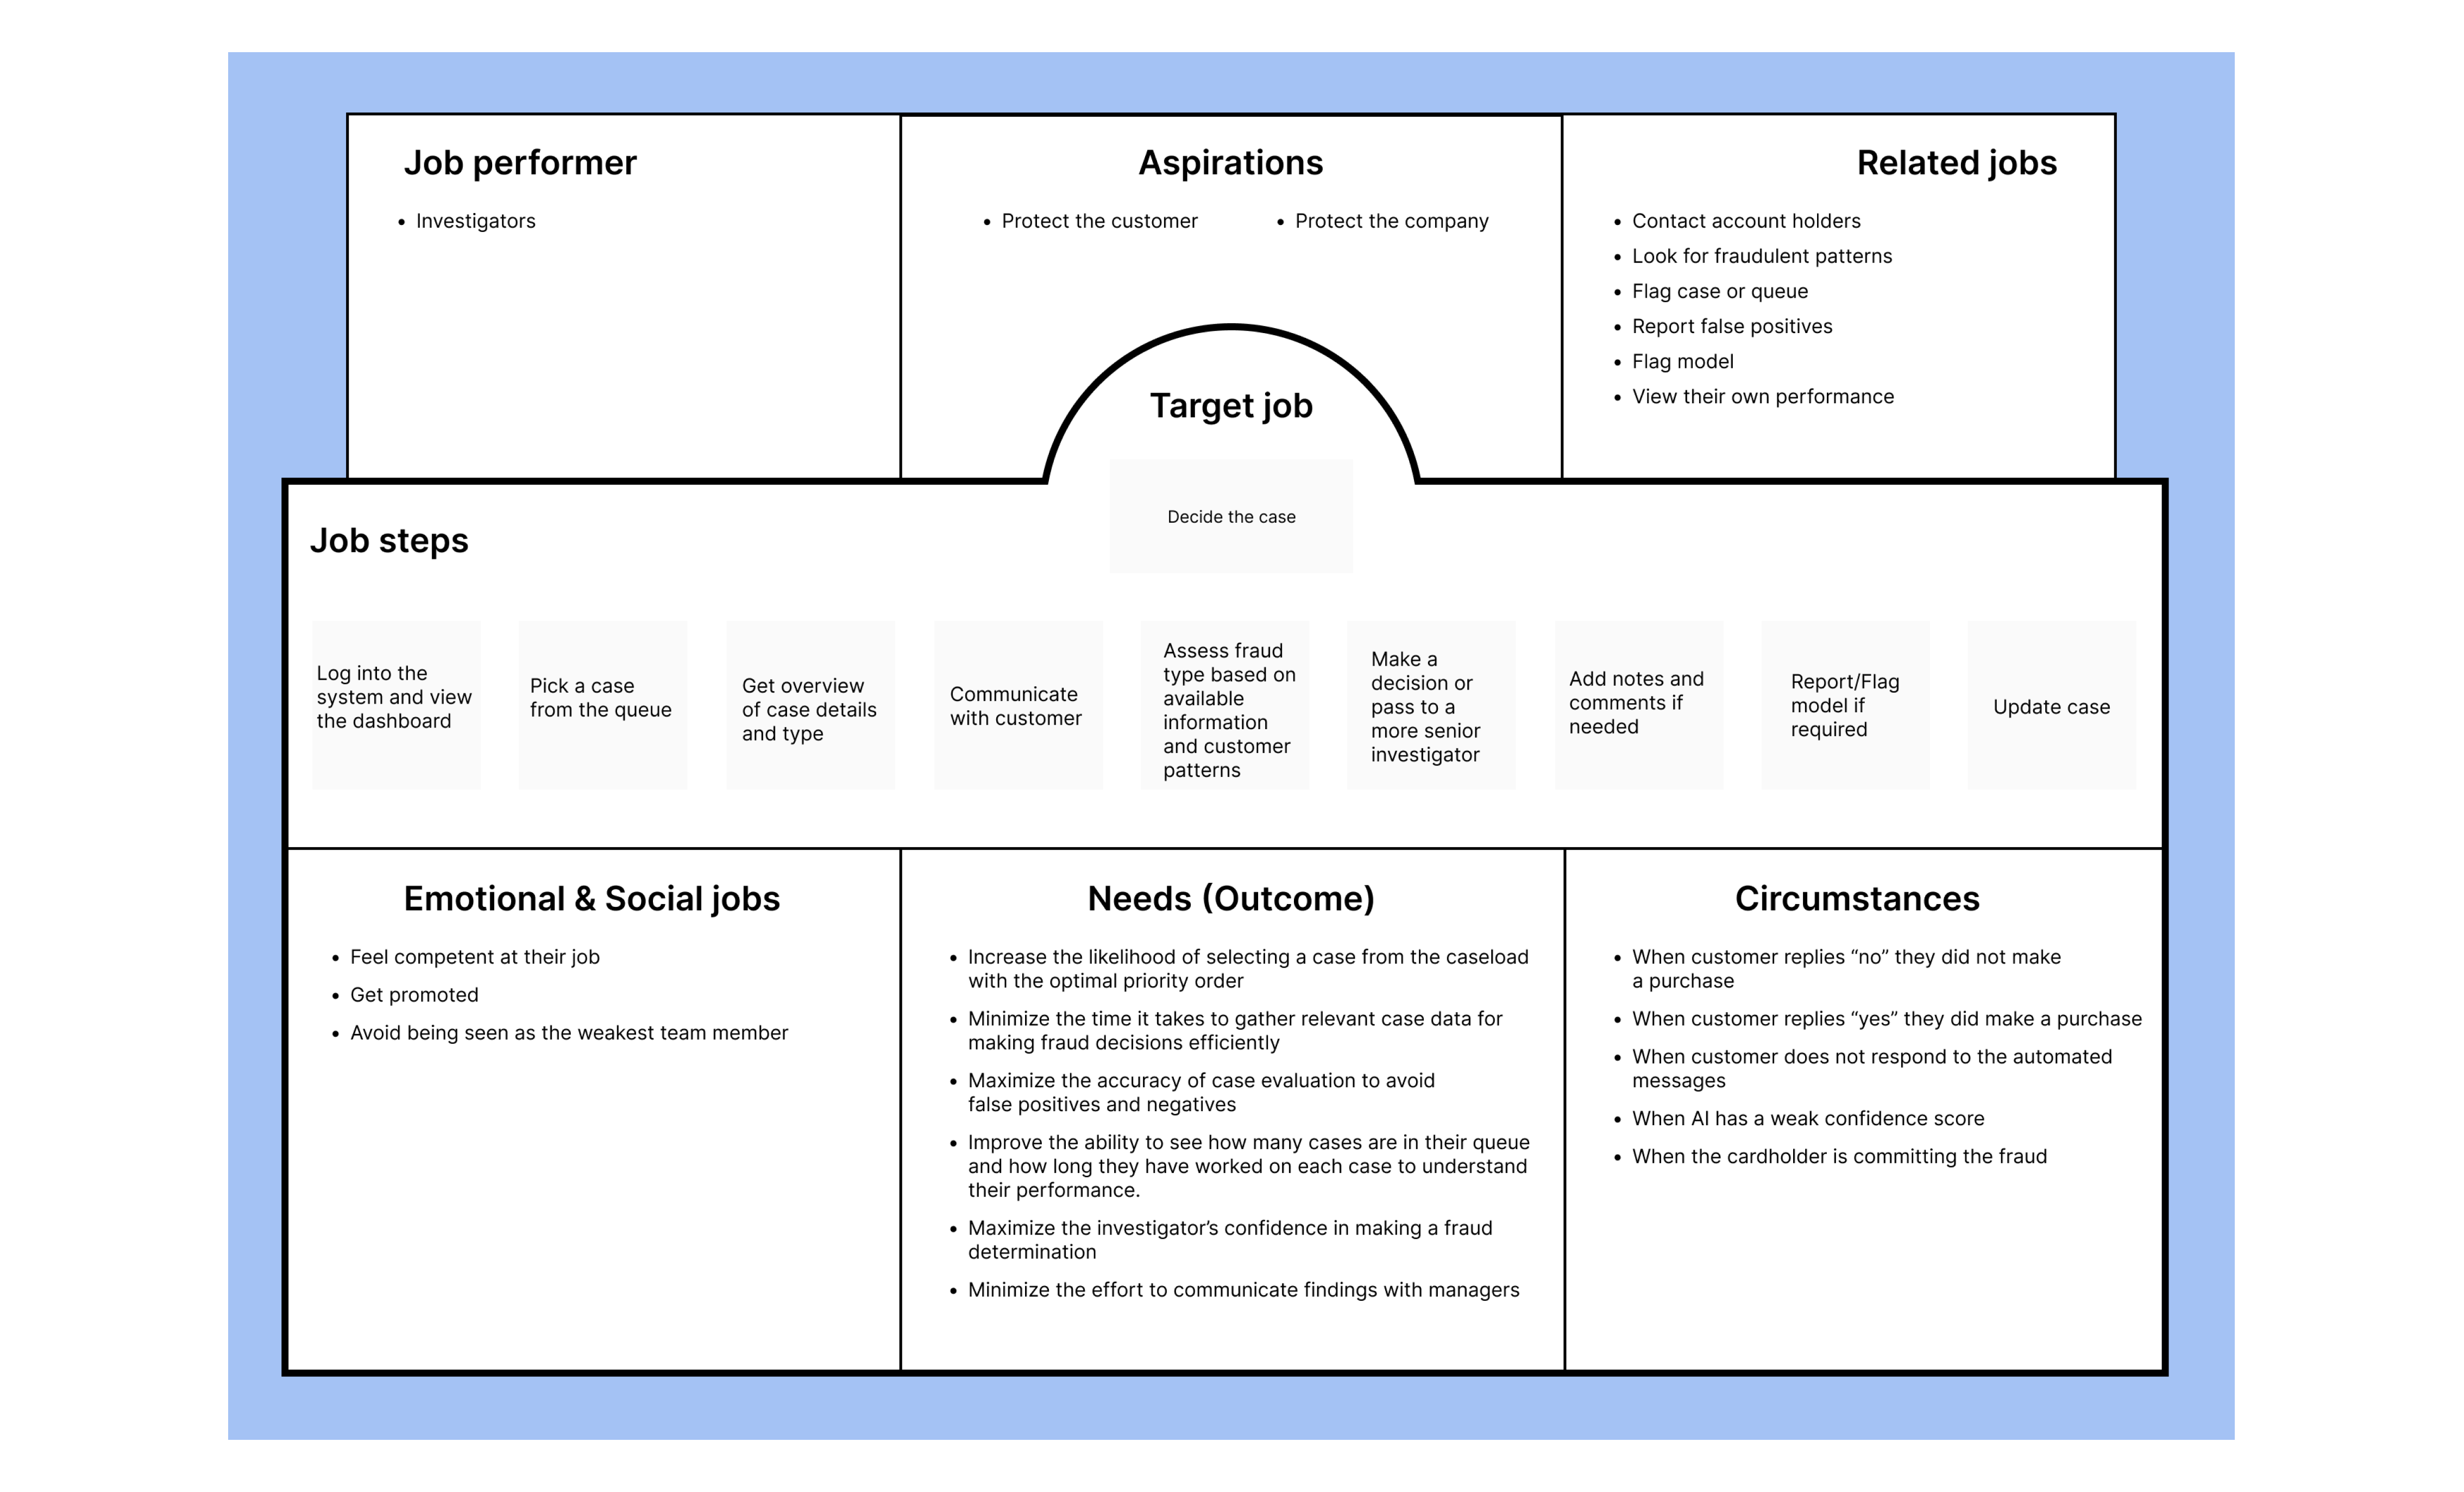
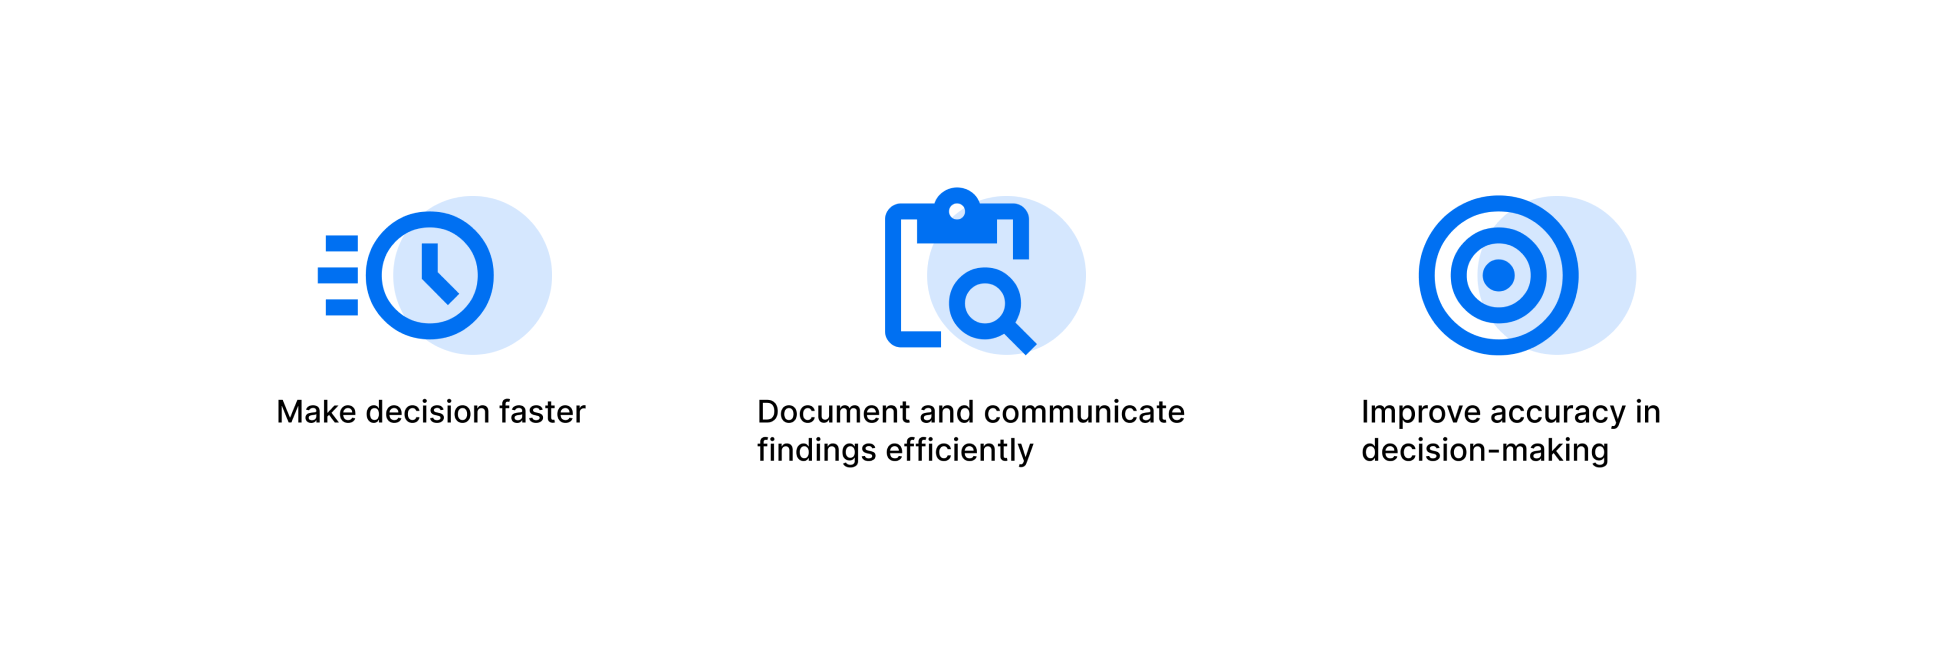
How might we help Adam to
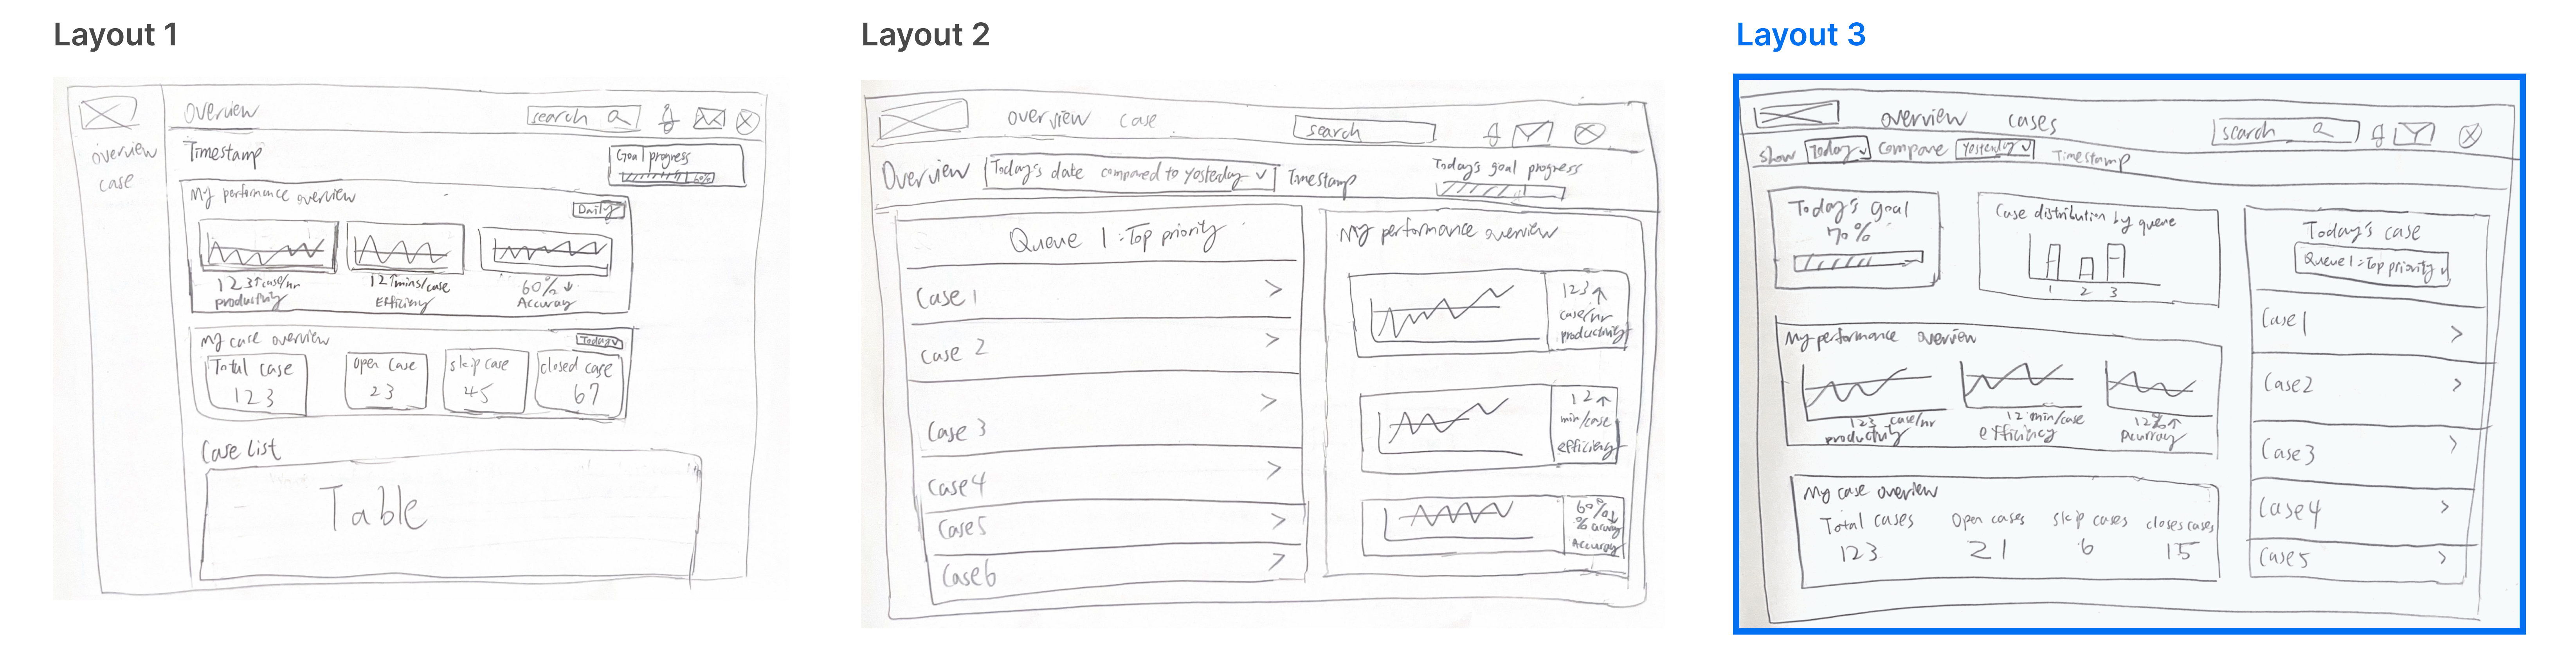
Sketching ✏️
After brainstorming and gaining a clear understanding of which information should be displayed on the screen, I began sketching the overview page. My main goal was to determine which layout design could best provide a high-level performance overview and the most efficient way to solve cases on the dashboard.
Design system 🛠️
For this project, I utilized the SAP Fiori design system, leveraging its principles and components to create a cohesive and user-friendly interface. By adhering to Fiori’s guidelines, I ensured consistency, accessibility, and scalability throughout the design, aligning with industry standards for enterprise-level applications.
Initial mid-fi wireframe 🎨
I translated the sketches into mid-fidelity wireframes by using SAP Fiori’s design system principles and components to accelerate the design process.
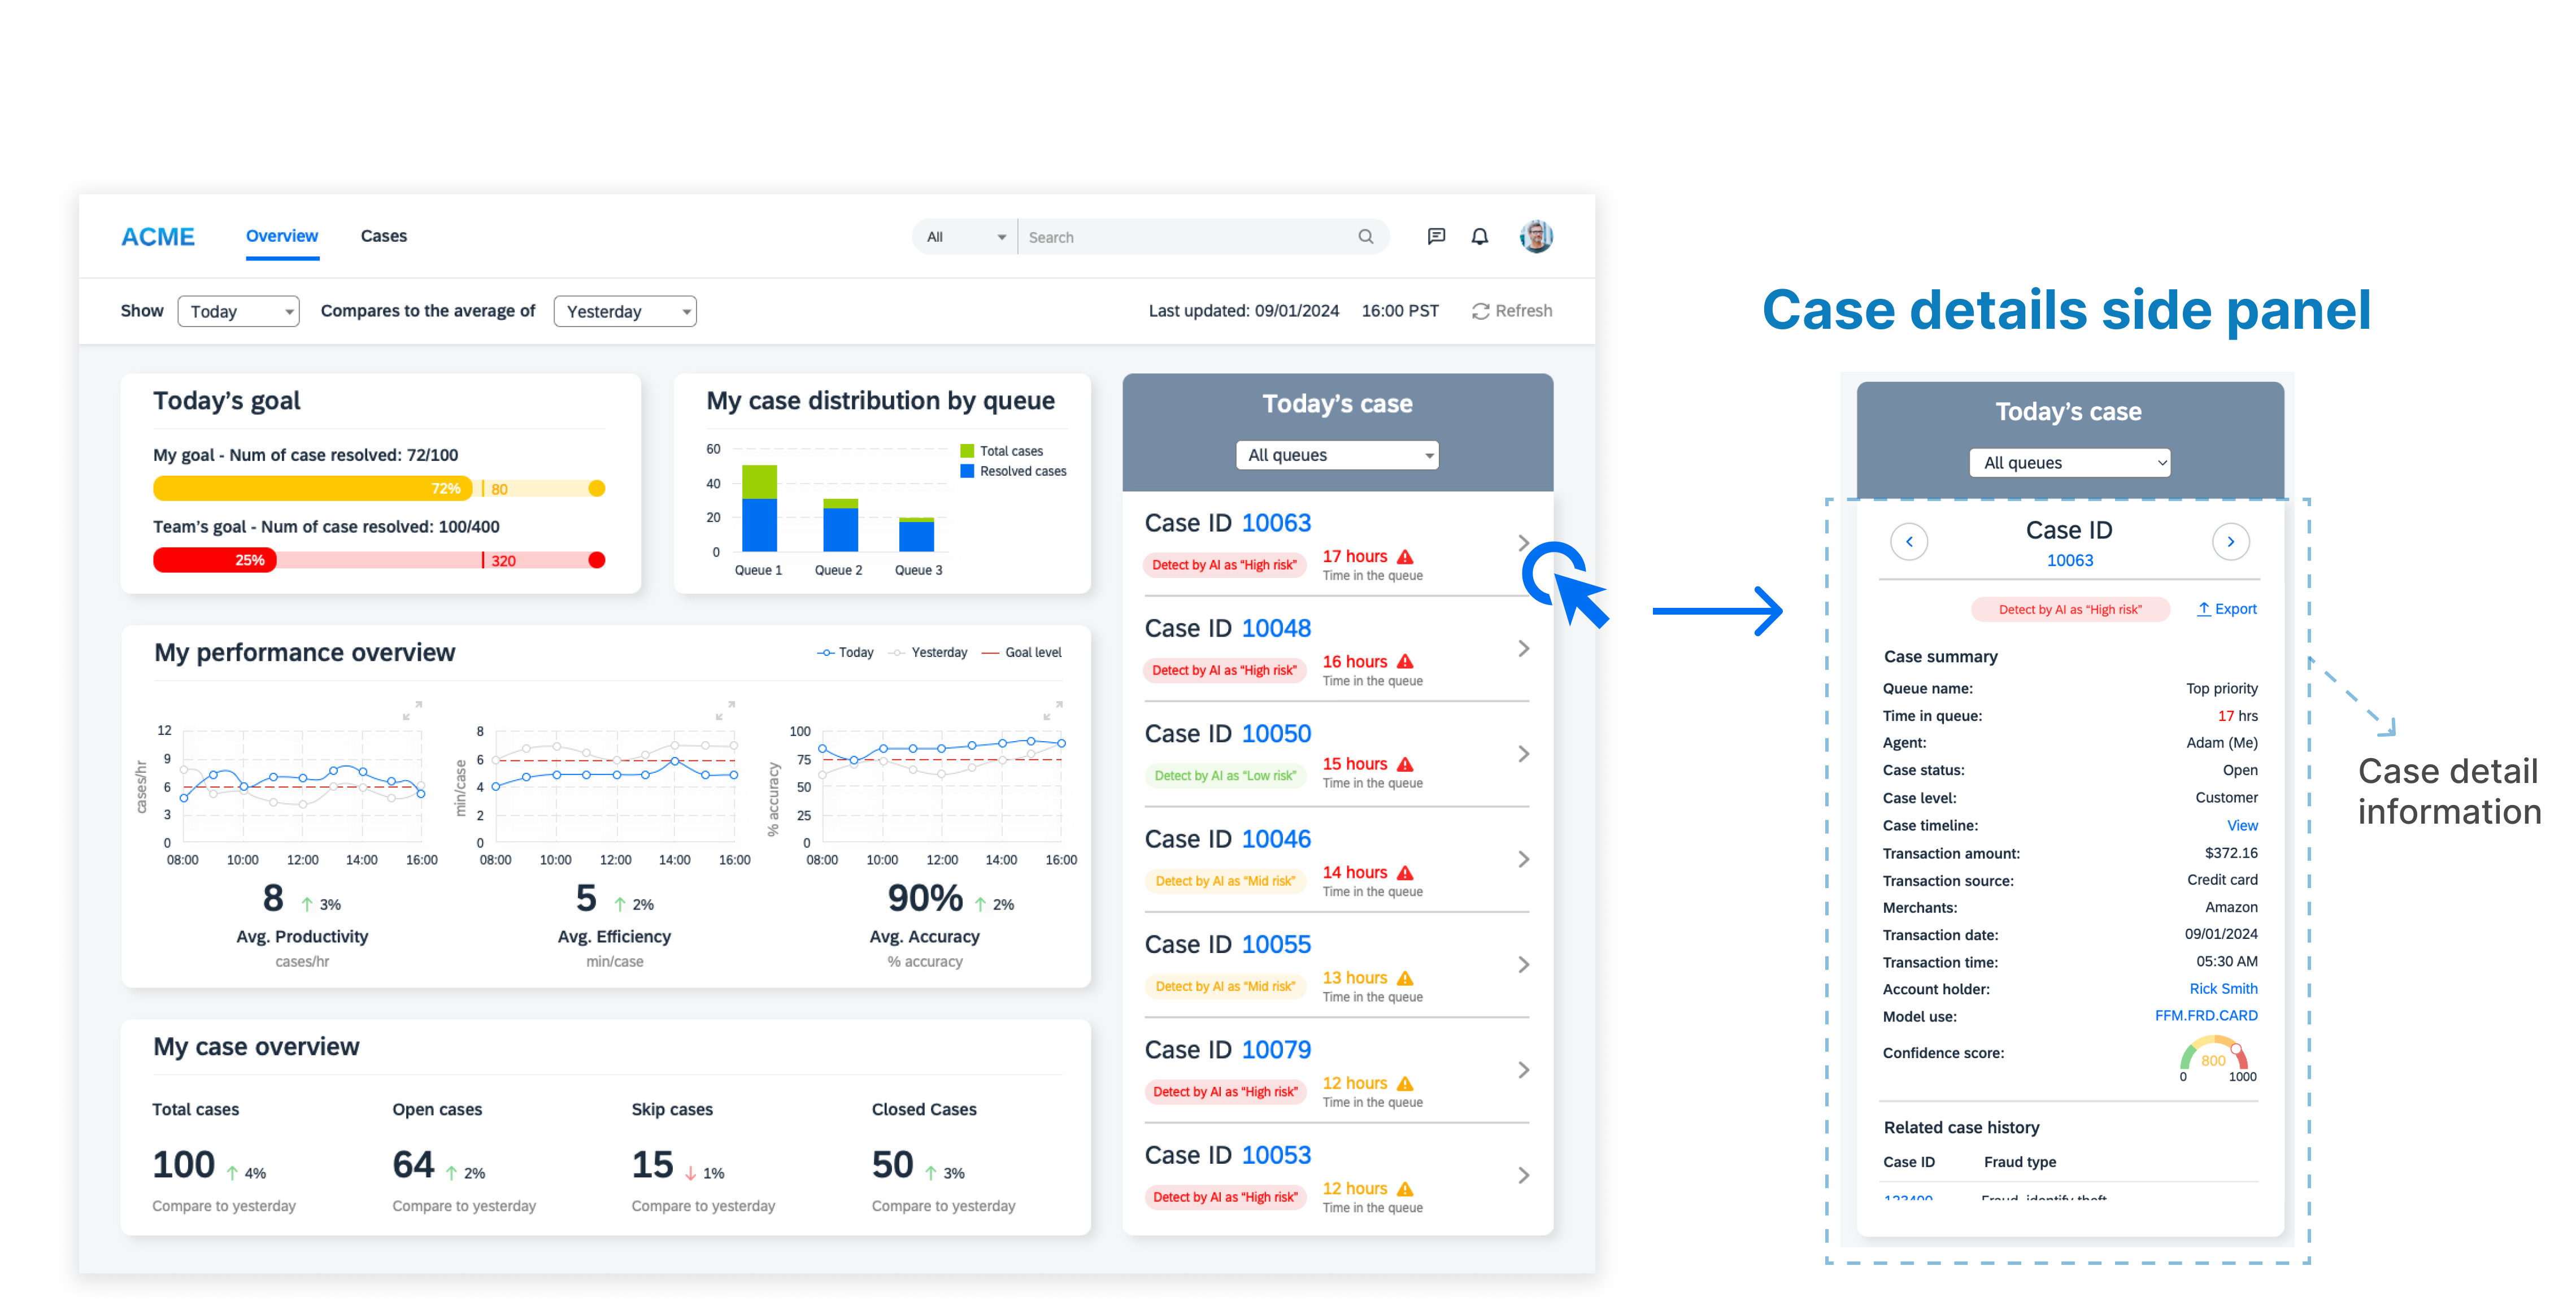
Initial mid-fi prototype ▶️
– Flow: Update the case from the overview page-
Iteration 🔄
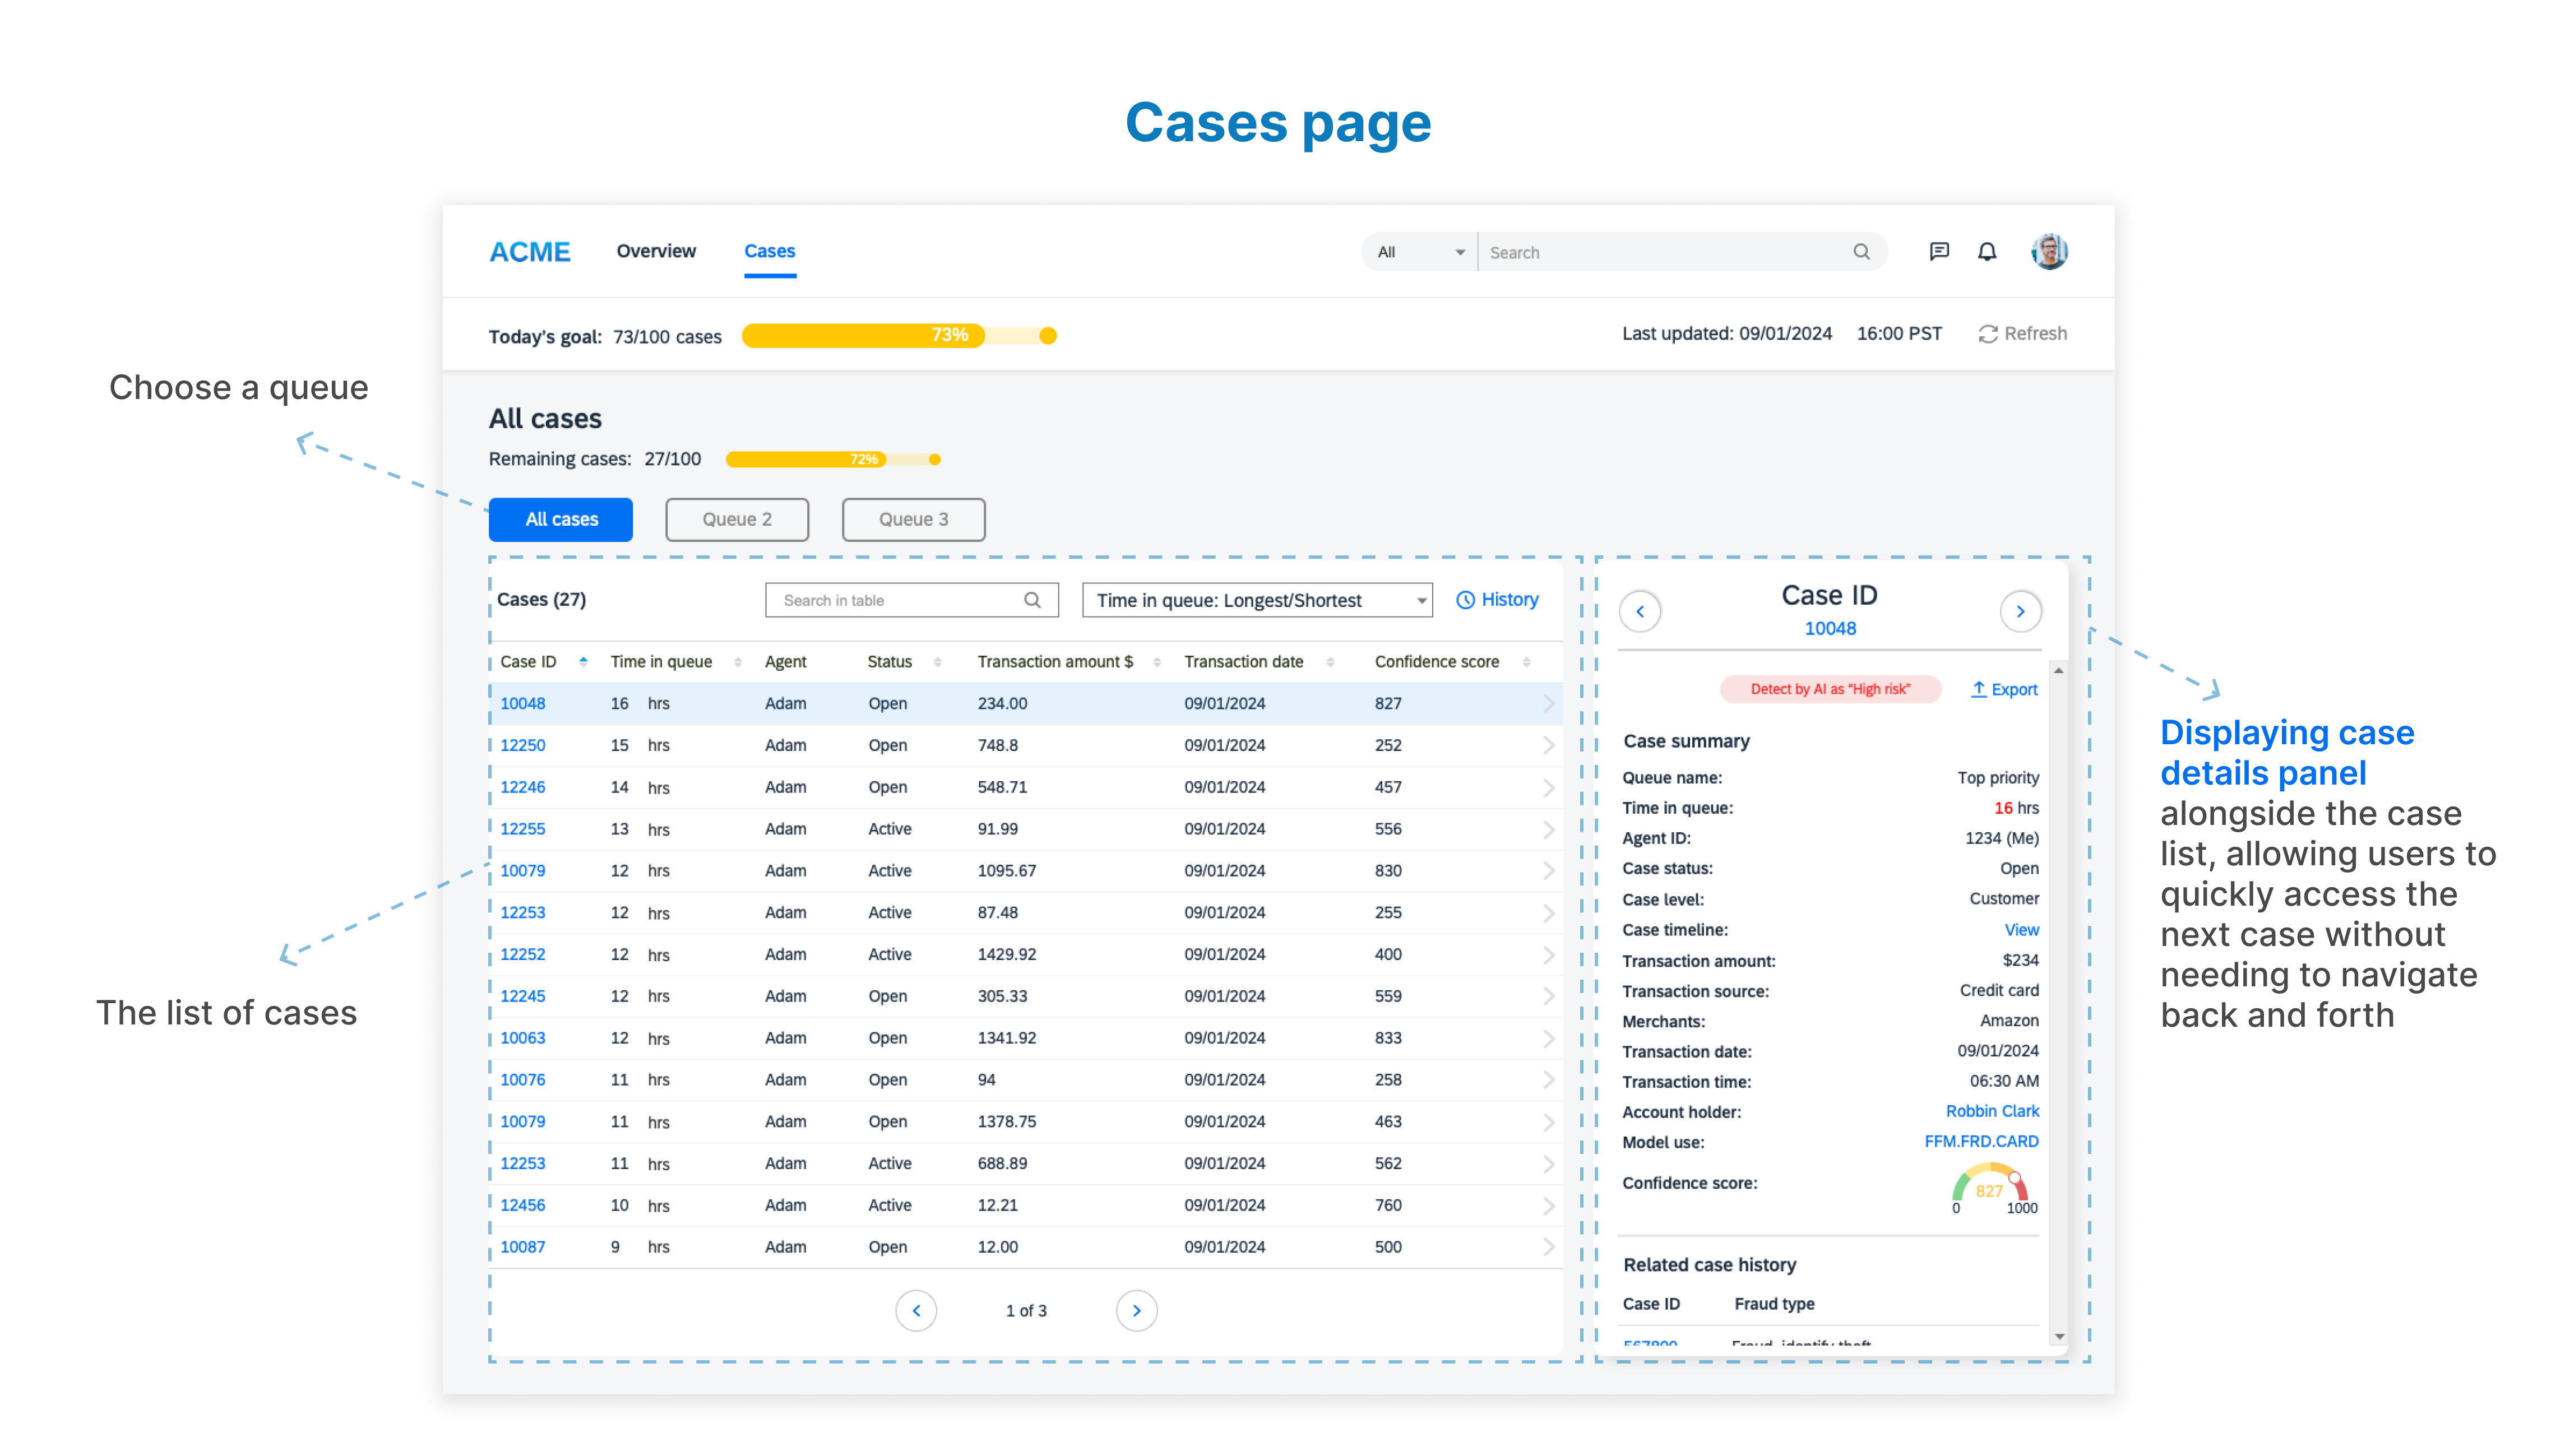
After conducting usability testing with 5 fraud investigators using 6 simulated credit card fraud cases, we found that while the original layout improved accuracy, it also increased task completion time.
Investigators shared that they preferred viewing all case details in a full-screen format, as they were already used to that layout. It allowed them to work more efficiently and minimized the need for excessive scrolling.
Based on this feedback, I pivoted the design to better match users’ mental model and streamlined the experience to support key performance indicators (KPIs) including task success rate, time-on-task, error rate, fraud detection accuracy, and System Usability Scale (SUS) score.
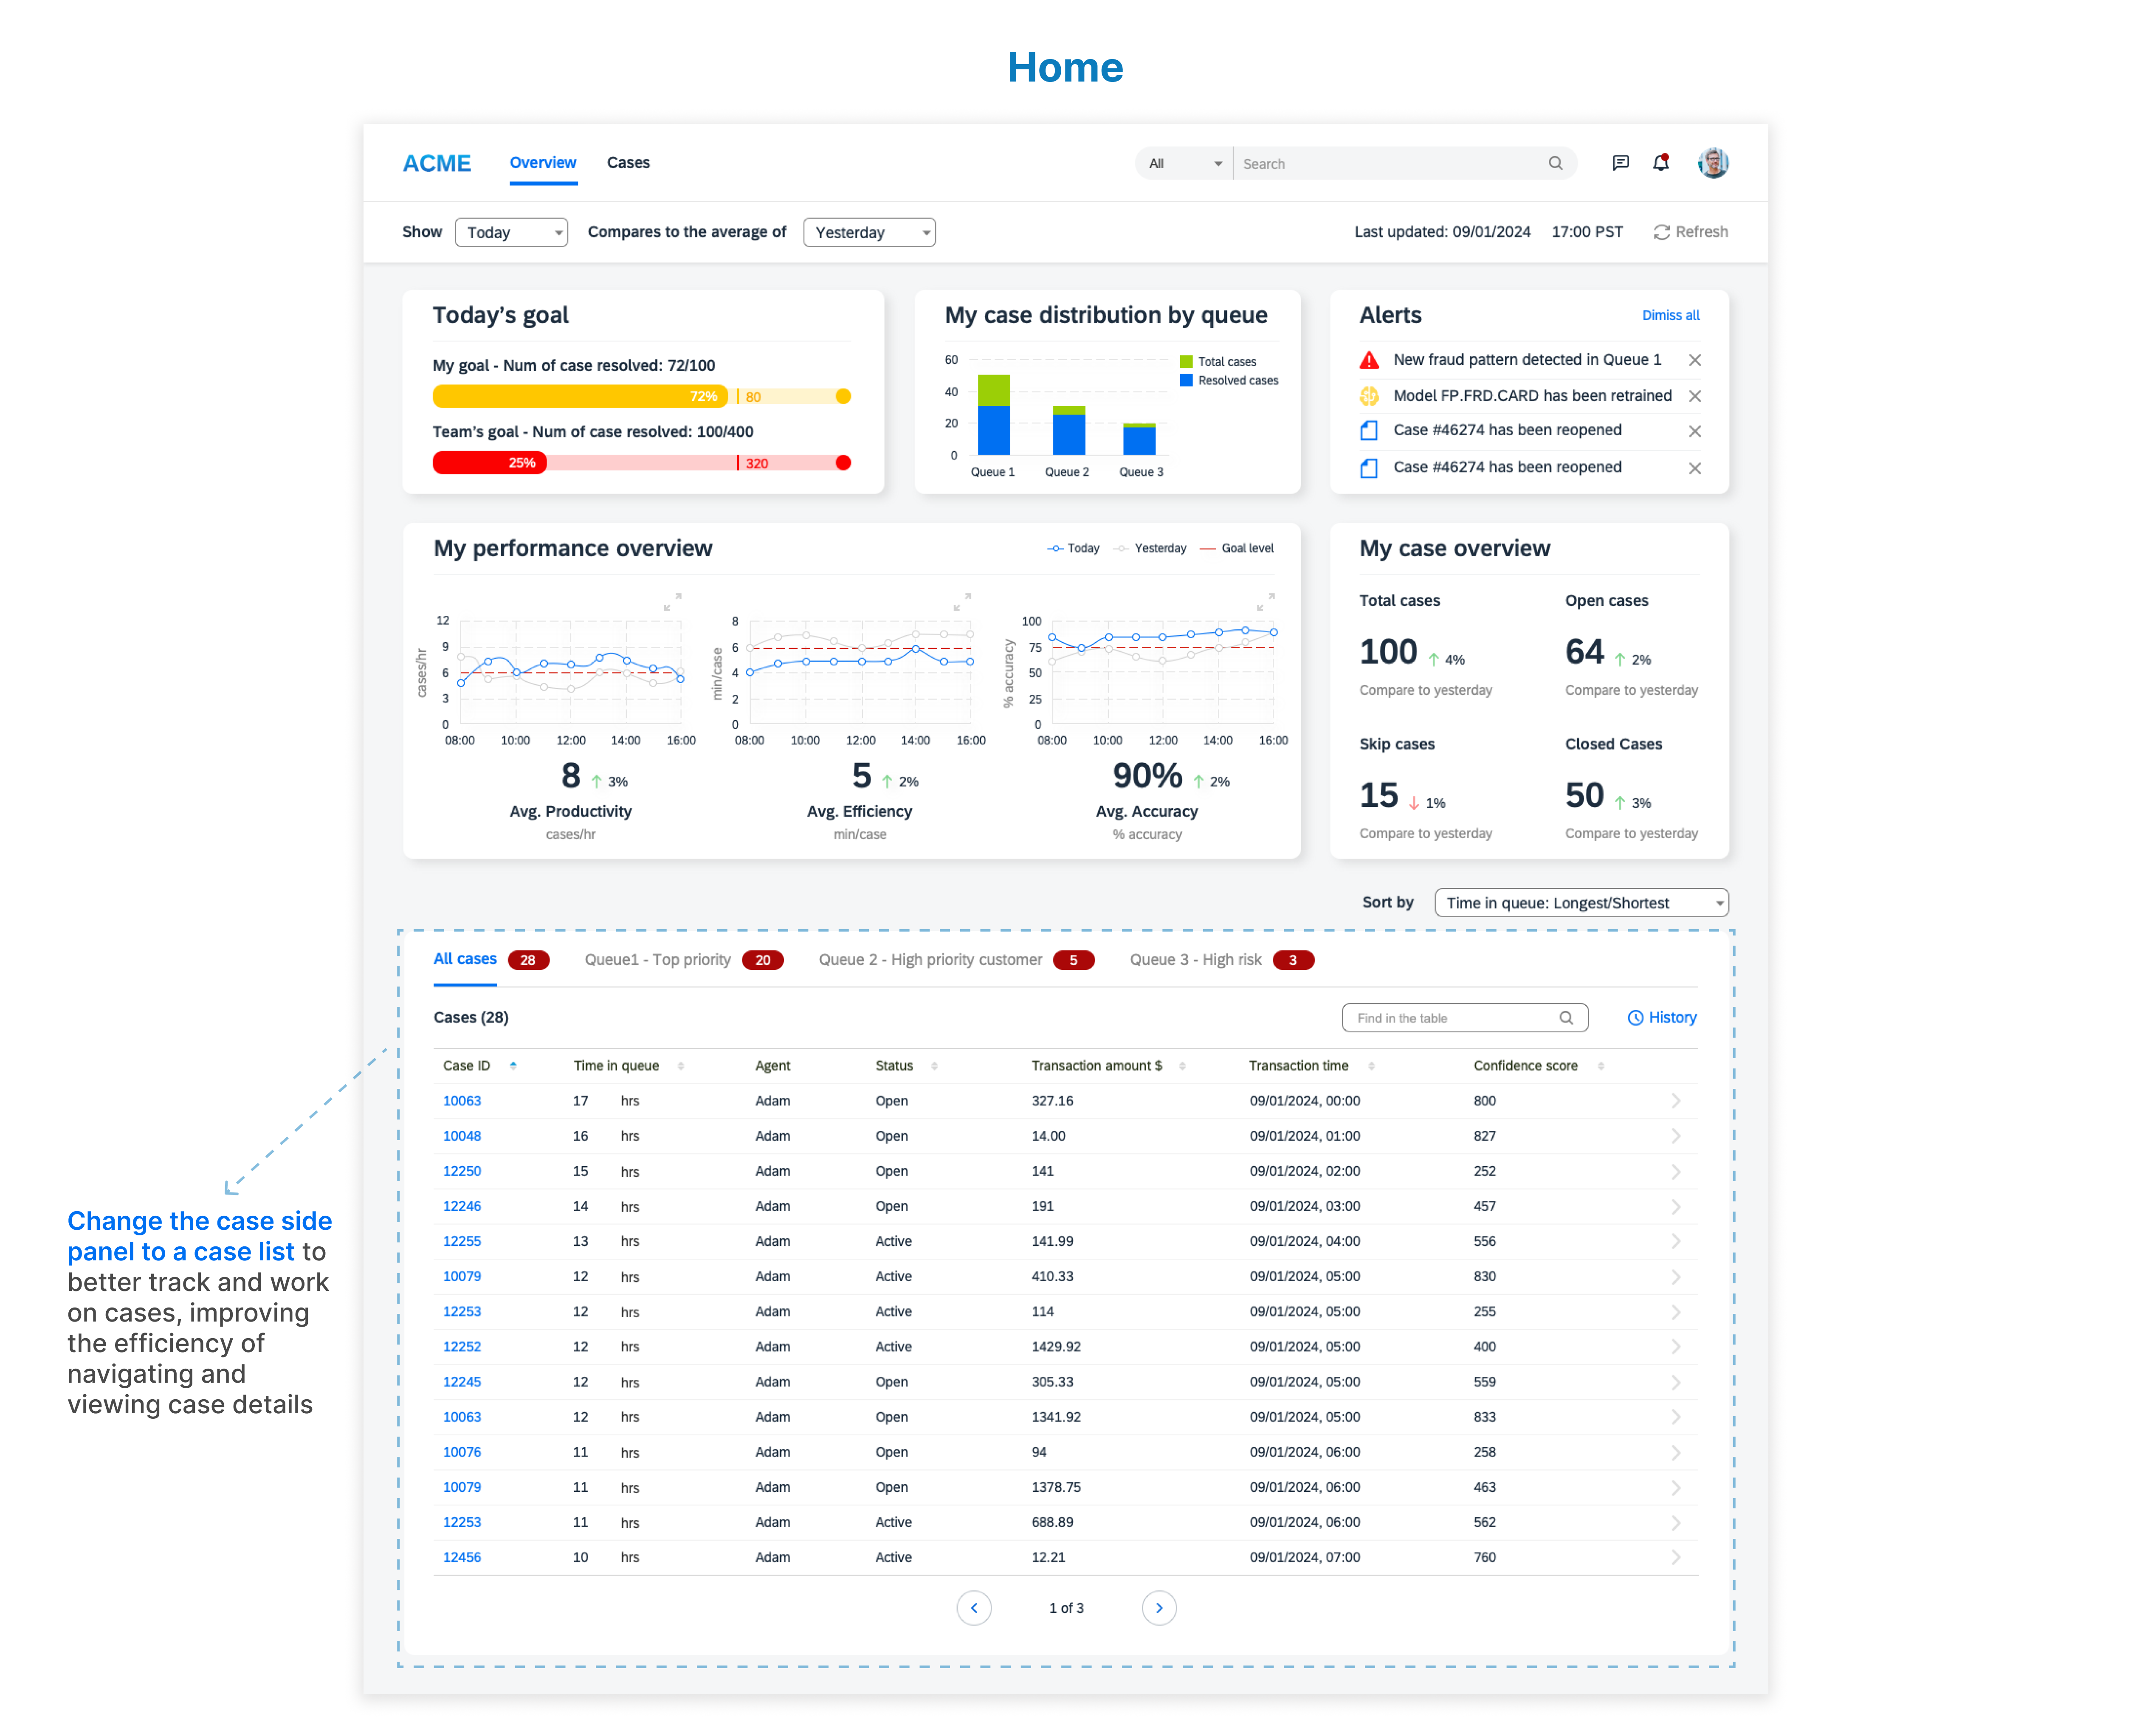
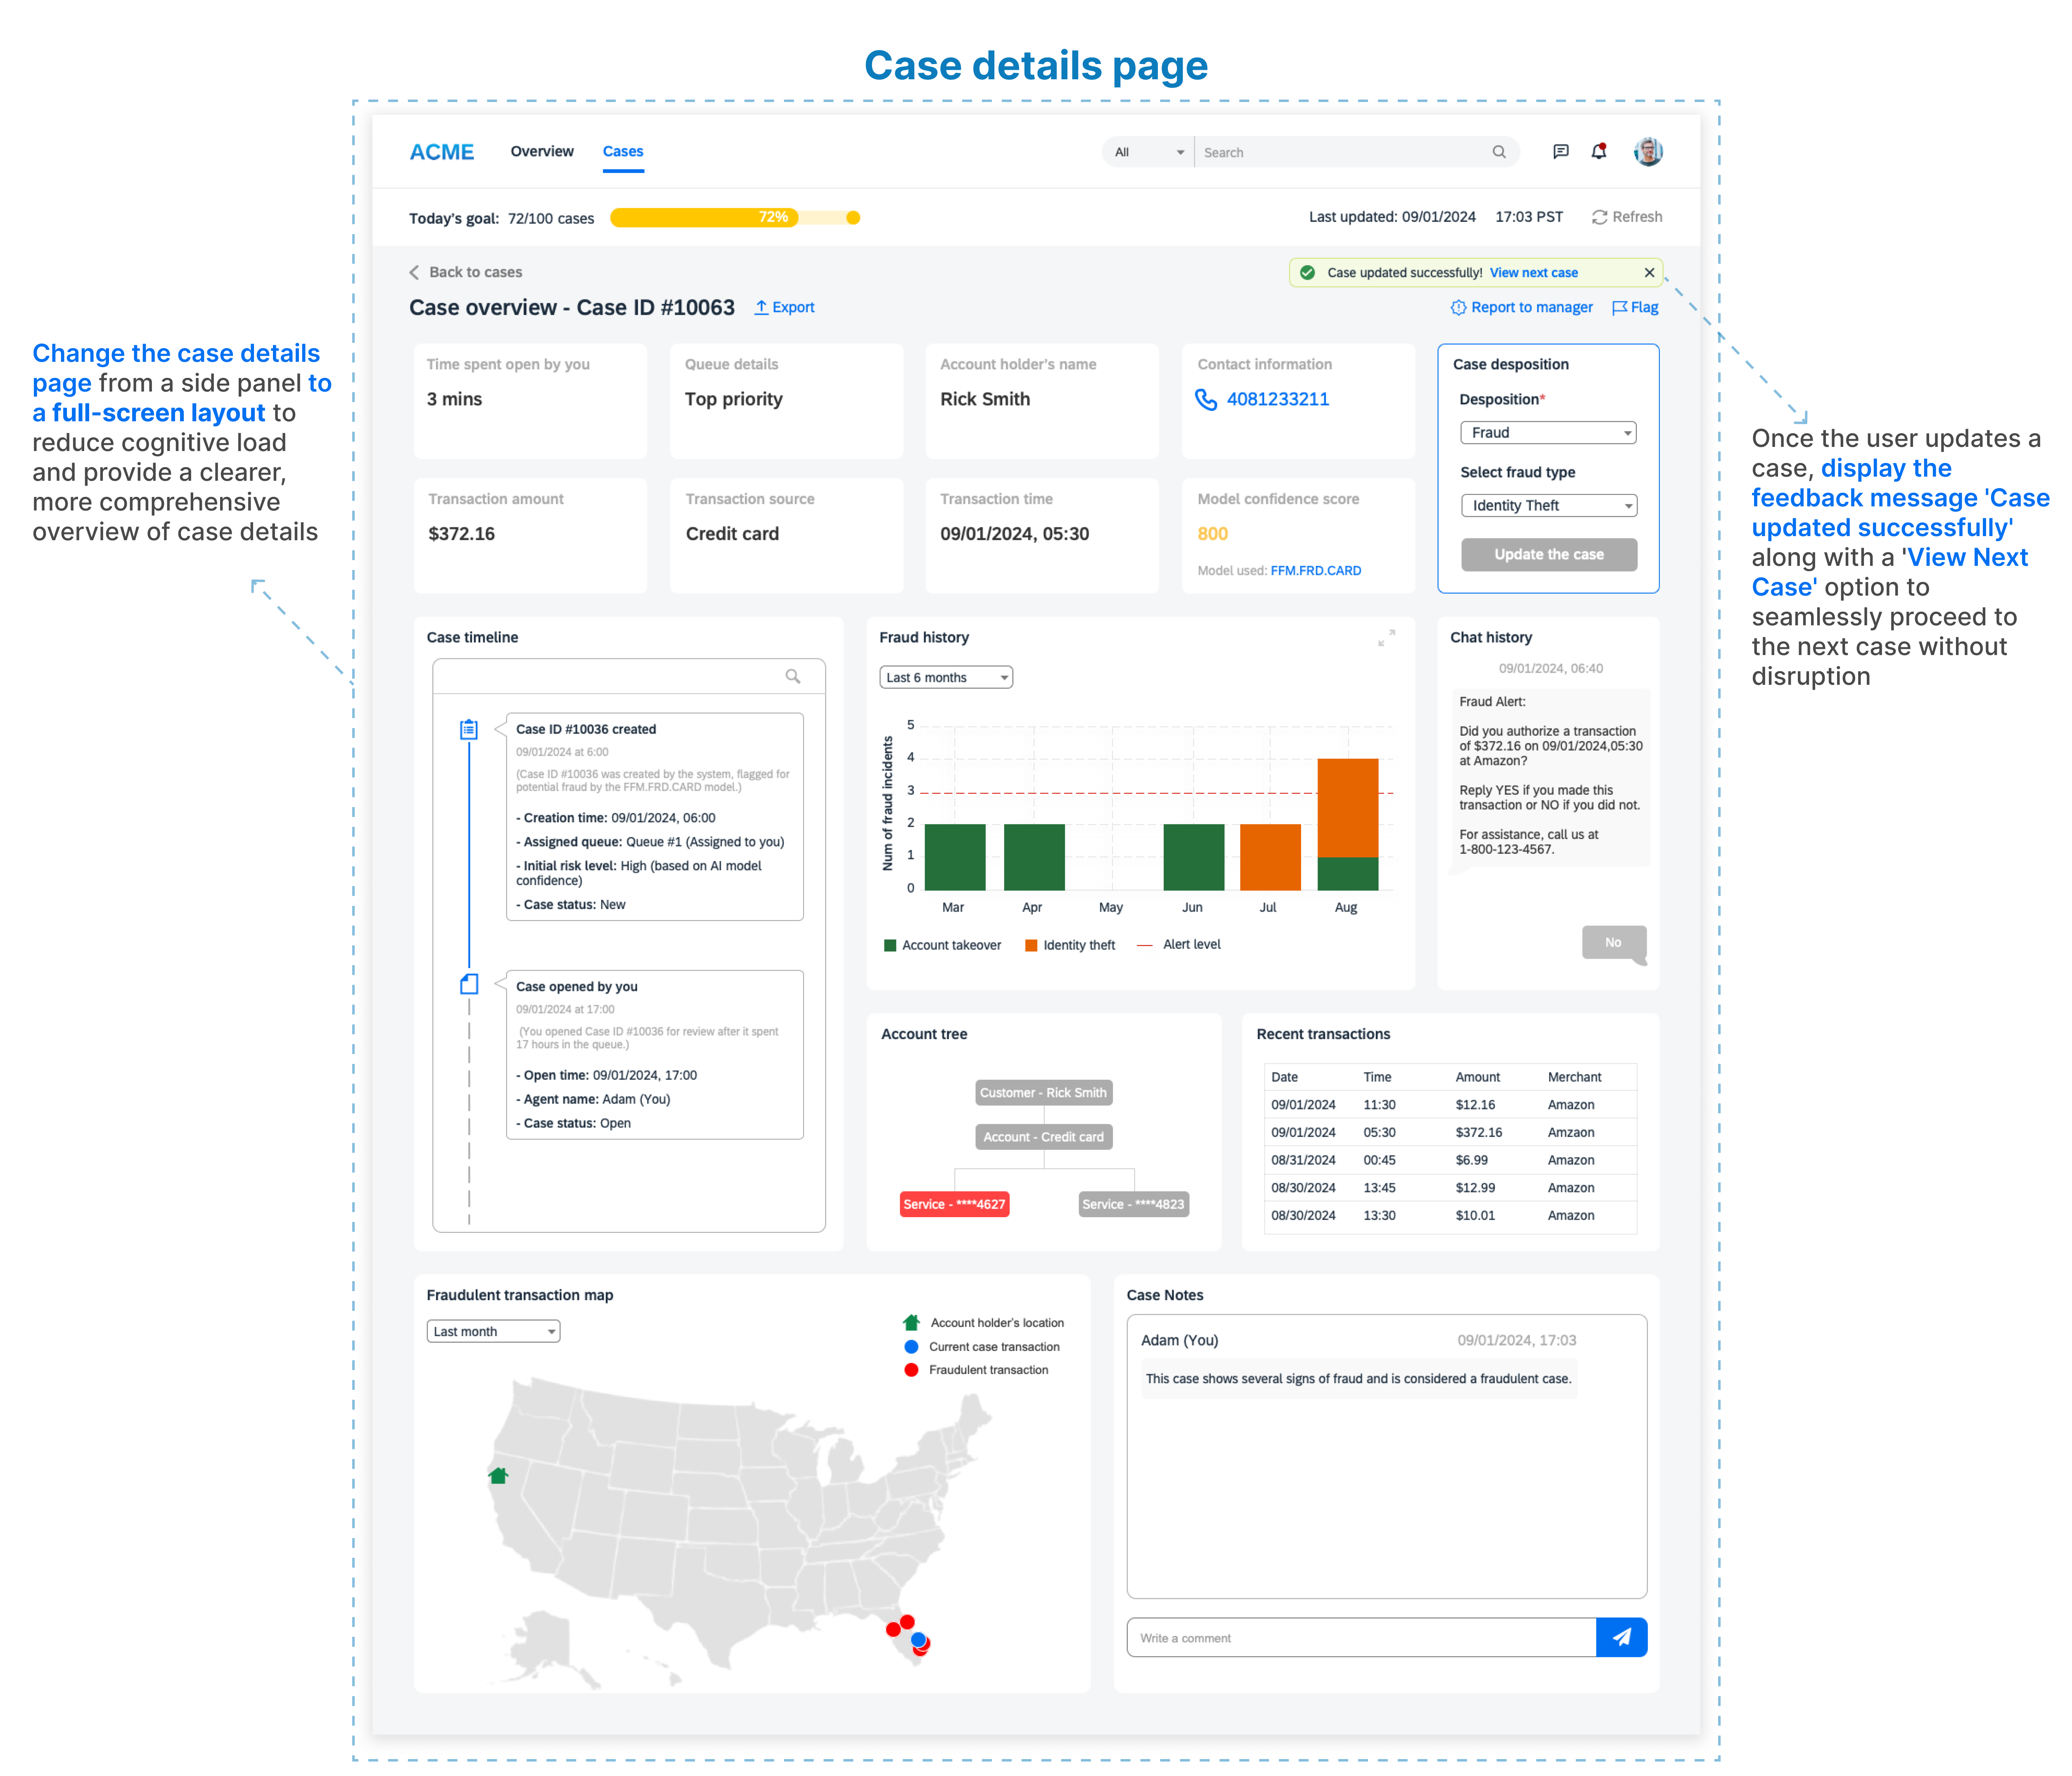
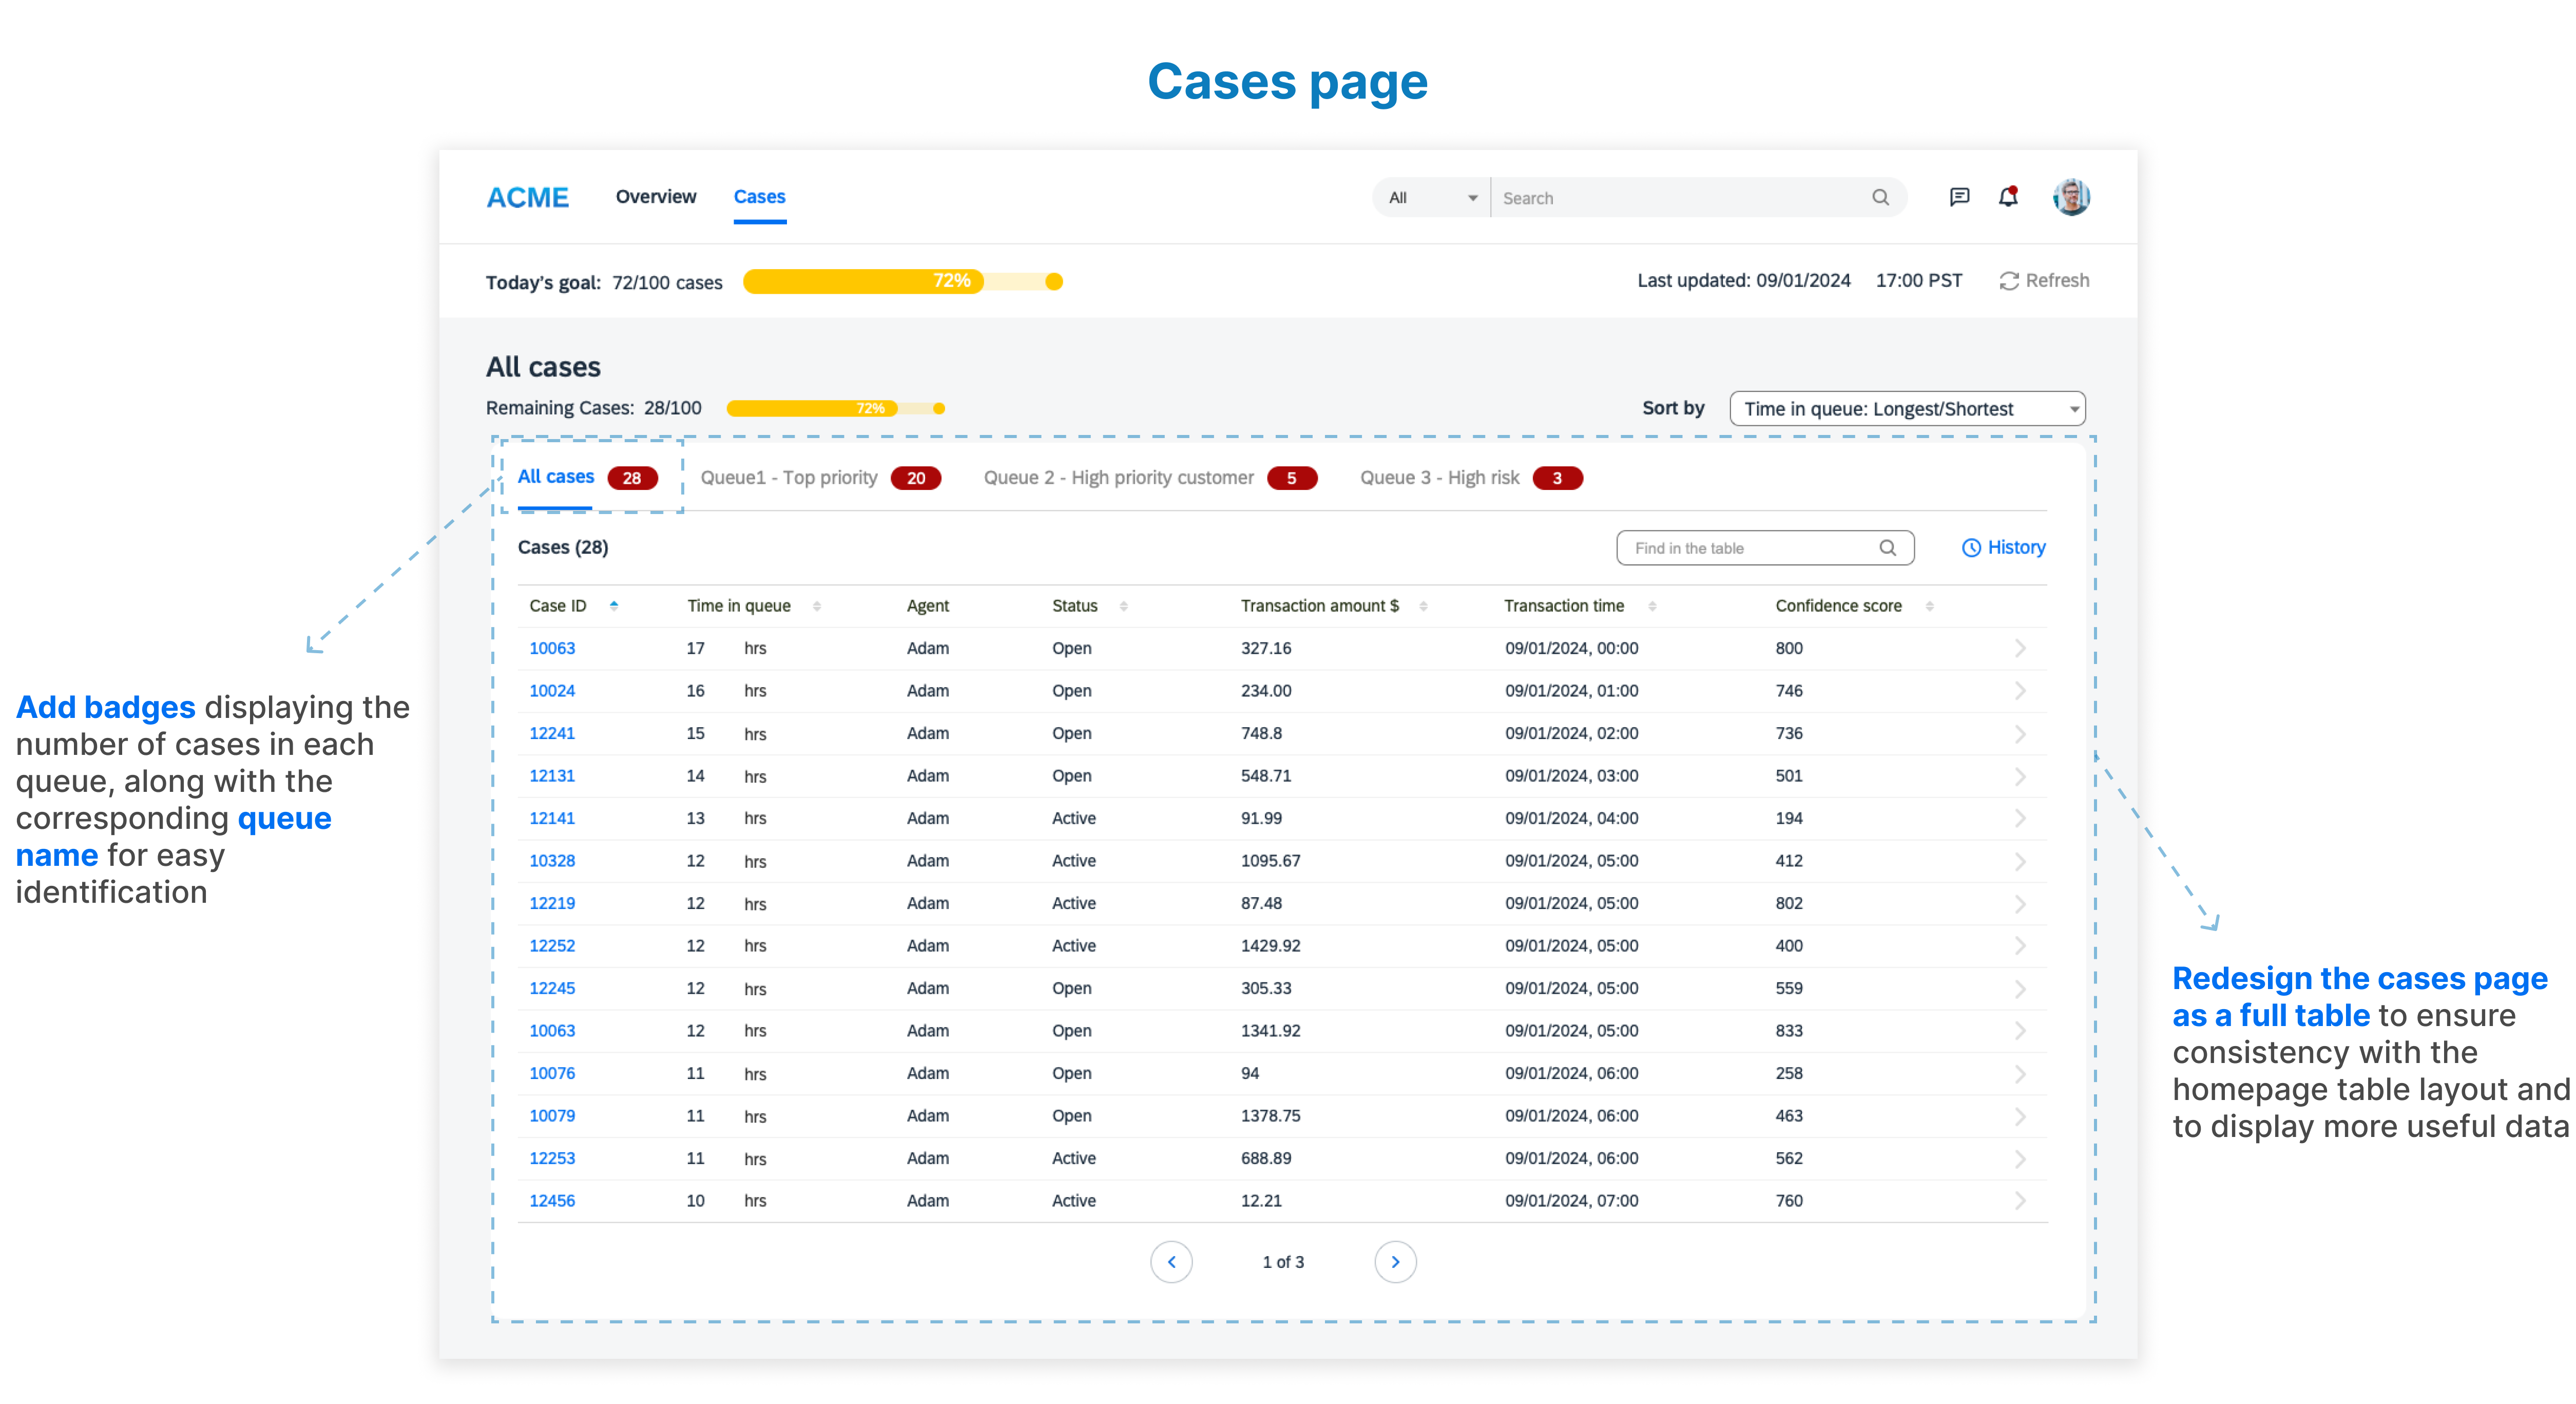
Final high-fi prototype ▶️
– Flow: Update the case from the overview page
Takeaways ✅
-Outcome-
After testing the prototype and gathering feedback, the design effectively met users’ needs. This new platform allows fraud investigators to work more efficiently, detect fraud faster, and with greater accuracy than the previous software.
-What I learned-
- The value of proactive communication: Reaching out to the PM and clarifying user needs was essential to align the design with real-world use cases.
- Understanding the real context matters more than new ideas: Just because a design looks fresh or different doesn’t mean it works better. The best solutions come from knowing how users actually work in real situations.
- Continuously seeking feedback: Seeking and incorporating feedback throughout the design process ensures the final product meets user expectations and addresses their pain points.
